Principles of Economics 2e
2nd Edition
ISBN: 9781947172364
Author: Steven A. Greenlaw; David Shapiro
Publisher: OpenStax
expand_more
expand_more
format_list_bulleted
Question
Please correct answer and don't use hand rating

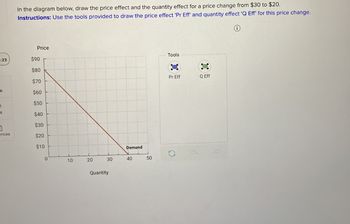
Transcribed Image Text:In the diagram below, draw the price effect and the quantity effect for a price change from $30 to $20.
Instructions: Use the tools provided to draw the price effect 'Pr Eff' and quantity effect 'Q Eff' for this price change.
Price
:23
$90
Tools
$80
$70
Pr Eff
Q Eff
k
$60
$50
ht
$40
1
$30
ences
$20
$10
Demand
0
10
20
30
40
50
Quantity
Expert Solution
This question has been solved!
Explore an expertly crafted, step-by-step solution for a thorough understanding of key concepts.
Step by stepSolved in 2 steps

Knowledge Booster
Similar questions
- PRICE (Yen per gram) 100 90 80 70 60 40 30 20 10 0 0 0 Demand + 20 40 60 80 100 120 140 160 180 200 QUANTITY (grams of uff per month) Graph Input Tool Demand for Uff Price of Uff (Yen per gram) to eat my uff this morning, but there wasn't any Quantity Demanded DEMAND SHIFTERS Average Income -(Yen per month) Price of Tulg (Yen per gram) Price of Snick (Yen per gram) Of Suppose that the price of a gram of uff decreased from 50 yen to 40 yen. This would cause a an increase in 50 100 100 20 50 Plug any value lower than the current number into the Average Income box. A decrease in average income causes a leftward the demand curve. the demand curve and therefore When the prices of tulg or snick change, there is a shift of the demand curve for uff. The directions of these changes imply that snick and uff are , and that tulg and uff are . For example, a Hermetian might say, "I went in my fridge. So instead of having uff for breakfast, I ate somearrow_forwardOnly typed answerarrow_forwardPlease both are question the correct please ASAP Don't answer by pen paper please ASAP explain.arrow_forward
- Info in picsarrow_forwardRefer to the figure and table to answer the following questions: Price (dollars per ounce) 0.50 0.45 0.40 0.35 0.30 2 0.25 0.20 0.15 0.10 0.05 ABCDEFG с H J A B с Point H to | = D E F G Price (per Ounce) $0.50 0.45 0.40 0.35 0.30 0.25 0.20 0.15 0.10 0.05 H 0 2 4 6 8 10 12 14 16 18 20 22 24 26 28 30 Quantity Demanded (ounces per show) 21 Quantity Demanded (Ounces per Show) 1 2 4 6 9 12 16 20 25 30 Instructions: In part a, round your responses to one decimal place. In part b, round your responses to two decimal places. a. Compute the price elasticity between points C and D and points H and I. Point C to D = b. Compute the total revenue at points C, D, H, and I. At point C = $ At point D = $ At point H = $ At point I = $ c. If there is a price decrease, total revenue will increase when demand is (Click to select)arrow_forwardTyped plz Please provide me a quality solution and take care of plagiarism also show each and every steparrow_forward
- Jskxokdarrow_forwardTyped and correct answer please. I ll rate accordinglyarrow_forwardHomework 7 i Saved 1 Number of Bushels (per Day) Total Total Total Marginal Marginal Price Revenue Cost Profit Revenue Cost 6 points 012345 $13 $0 $10 -$10 13 13 15 -2 13 26 13 39 13 13 2285 22 4 31 8 52 44 8 65 61 4 13333 $13 13 1764G $5 Print Mc Graw Hill Help Save & Exit Su If the price of catfish fell from $13 to $7 per bushel, determine the Instructions: Enter your responses as a whole number. If you are entering any negative numbers be sure to include a negative sign (-) in front of those numbers. a. Profit-maximizing output. bushel(s) b. Profit or loss per bushel. Search L hiji's o ofarrow_forward
- PRICE (Dollars per room) 500 450 400 350 300 250 200 150 100 50 0 Demand 0 50 100 150 200 250 300 350 400 450 500 QUANTITY (Hotel rooms) Graph Input Tool Market for Lakes's Hotel Rooms Price (Dollars per room) Quantity Demanded (Hotel rooms per night) Demand Factors Average Income (Thousands of dollars) Airfare from DSM to ACY (Dollars per roundtrip) Room Rate at Mountaineer (Dollars per night) 350 150 50 100 200 ? For each of the following scenarios, begin by assuming that all demand factors are set to their original values and Lakes is charging $350 per room per night. If average household income increases by 10%, from $50,000 to $55,000 per year, the quantity of rooms demanded at the Lakes rooms per night to rooms per night. Therefore, the income elasticity of demand is from , meaning that hotel rooms at the Lakes are If the price of an airline ticket from DSM to ACY were to increase by 50%, from $100 to $150 roundtrip, while all other demand factors remain at their initial values,…arrow_forward6. Elasticity and total revenue The following graph shows the daily demand curve for bikes in Chicago. Use the green rectangle (triangle symbols) to compute total revenue at various prices along the demand curve. Note: You will not be graded on any changes made to this graph. 120 110 Total Revenue 100 90 80 70 60 40 A 30 20 10 Demand 16 24 32 40 48 56 64 72 80 88 96 QUANTITY (Bikes) PRICE (Dollars per bike) 50arrow_forwardShoes 05 O 0.5 2 30 What is pButter/pShoes? 1/5 150 Butterarrow_forward
arrow_back_ios
SEE MORE QUESTIONS
arrow_forward_ios
Recommended textbooks for you
 Principles of Economics 2eEconomicsISBN:9781947172364Author:Steven A. Greenlaw; David ShapiroPublisher:OpenStax

Principles of Economics 2e
Economics
ISBN:9781947172364
Author:Steven A. Greenlaw; David Shapiro
Publisher:OpenStax
