
MATLAB: An Introduction with Applications
6th Edition
ISBN: 9781119256830
Author: Amos Gilat
Publisher: John Wiley & Sons Inc
expand_more
expand_more
format_list_bulleted
Related questions
Question
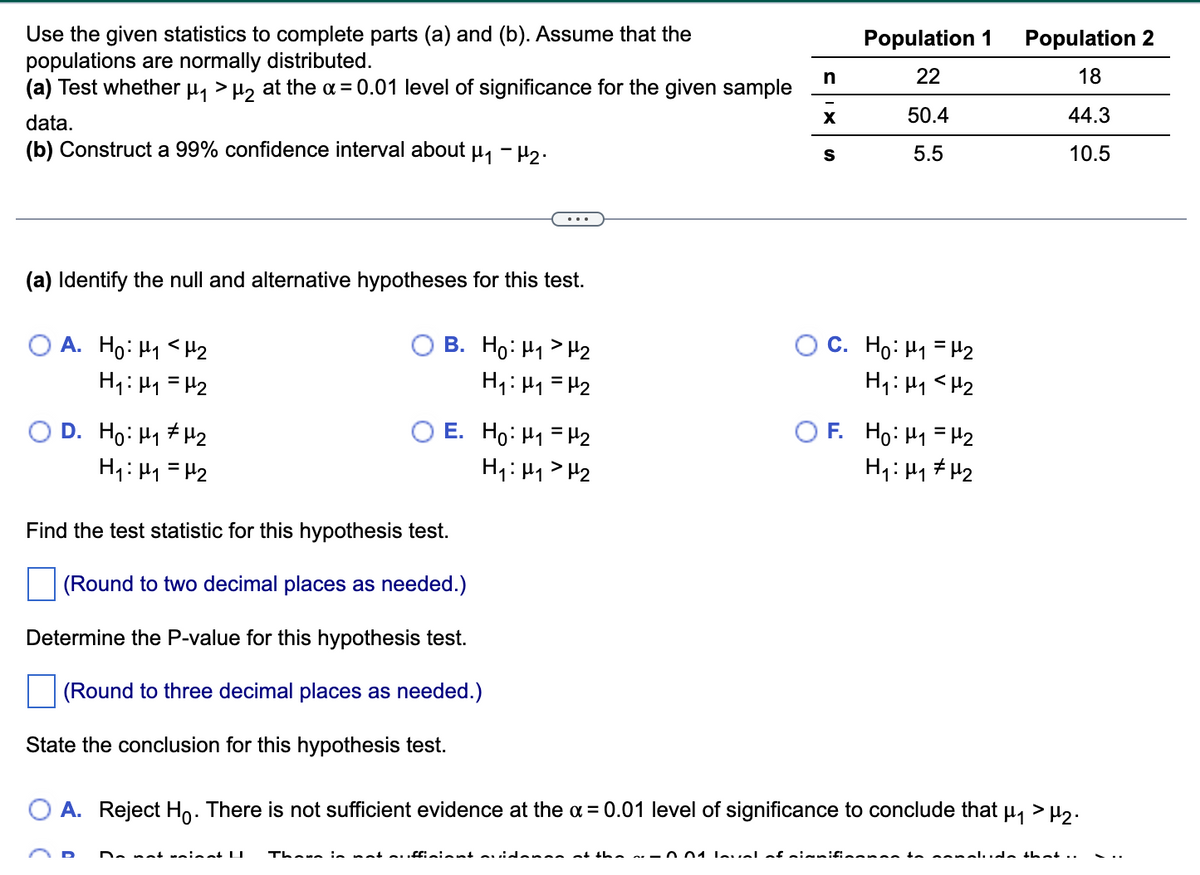

Transcribed Image Text:Use the given statistics to complete parts (a) and (b). Assume that the
populations are normally distributed.
(a) Test whether μ₁ > μ₂ at the α = 0.01 level of significance for the given sample
data.
(b) Construct a 99% confidence interval about μ₁ −μ₂.
(a) Identify the null and alternative hypotheses for this test.
A. Ho: M₁ <H₂
H₁: M₁ = H₂
D. Ho: H₁ H₂
H₁: H₁ = H₂
B. Ho: H₁ H₂
H₁: H₁ H₂
E. Ho: ₁ = ₂
H₁: H₁ H₂
Find the test statistic for this hypothesis test.
(Round to two decimal places as needed.)
Determine the P-value for this hypothesis test.
(Round to three decimal places as needed.)
State the conclusion for this hypothesis test.
Do not waingt U
n
X
S
Population 1
22
50.4
5.5
C. Ho: ₁ = ₂
H₁: M₁ <H₂2
F. Ho: M₁ = ₂
H₁: H₁ H₂
Population 2
18
44.3
10.5
O A. Reject Ho. There is not sufficient evidence at the x = 0.01 level of significance to conclude that µ₁ > µ₂.
There is not sufficient suidenan at the ~-004 level of significance to conclude that ..
Expert Solution
This question has been solved!
Explore an expertly crafted, step-by-step solution for a thorough understanding of key concepts.

This is a popular solution

Trending nowThis is a popular solution!

Step by stepSolved in 3 steps

Knowledge Booster

Similar questions
- Find the critical value t Subscript c for the confidence level c=0.99 and sample size n=18.arrow_forwardFind the critical value t Subscript c for the confidence level c=.90. and sample size n=20.arrow_forward4. Test the claim about the population mean, μ,at the given level of significance using the given sample statistics. Claim: μ≠6000; α=0.08; σ=399. Sample statistics: x=6300, n=37 Determine the outcome and conclusion of the test. Choose from the following. A. Fail to reject H0. At the 8% significance level, there is not enough evidence to reject the claim. B. Reject H0. At the 8% significance level, there is enough evidence to reject the claim. C. Reject H0. At the 8% significance level, there is enough evidence to support the claim. D. Fail to reject H0. At the 8% significance level, there is not enough evidence to support the claim.arrow_forward
- You wish to test the following claim (HaHa) at a significance level of α=0.01α=0.01. Ho:μ1=μ2Ho:μ1=μ2 Ha:μ1≠μ2Ha:μ1≠μ2You obtain the following two samples of data. Sample #1 Sample #2 65.8 77.7 105.1 78.6 89.2 69.1 96.7 91.3 105.9 87.5 70.5 93.9 83.4 88.3 79.5 66.7 83.4 91.7 106.7 73 75.7 98.7 76.7 80 53.2 92.1 93 78.2 72.4 79.1 82.1 74.1 78.2 85.5 85.9 99.3 84.2 104.3 88.3 107.6 63.8 99.8 97.7 86.3 74.9 72.7 77.5 93.9 76.1 77.1 81.9 74.1 73.6 78.7 81.9 78.9 81.1 88 85.8 75.3 74.3 77.5 69.1 75.5 72.9 80.1 84.3 73.1 67.3 72.2 76.1 67.8 74.9 67.3 74.7 70.1 65.4 76.9 83.8 79.7 72.9 81.7 74.1 68.2 65.4 80.9 69.4 79.5 96 77.5 77.1 75.9 68.7 What is the test statistic for this sample? (Report answer accurate to three decimal places.)test statistic = What is the p-value for this sample? For this calculation, use the degrees of freedom reported from the technology you are using. (Report answer accurate to four…arrow_forwardYou wish to test the following claim (HaHa) at a significance level of α=0.002α=0.002. Ho:μ1=μ2Ho:μ1=μ2 Ha:μ1<μ2Ha:μ1<μ2You obtain the following two samples of data. Sample #1 Sample #2 41.9 43.9 54.4 59.3 65.1 75.1 47.8 53.5 49.7 66.3 62.1 49.1 28.1 42.8 56.4 43.6 35.6 38.1 38.1 58.2 40.2 42.8 57.1 53.5 64 48.4 28.1 28.1 51.3 54.4 44.7 61.3 41.1 51.3 51.3 66.3 75.1 47.5 60.4 48.4 34.8 37.5 54.4 39.2 43.2 55.1 33.2 34 61.7 57.4 36.3 50.3 37.5 40.6 41.1 60.8 56.8 61.3 42.3 40.7 45.1 53.6 40 56.2 42.8 50.4 57.4 53.4 60.7 61 68.1 55.6 55.1 53.6 49.9 53.2 65.7 49.5 52.8 45.4 54.5 58.9 58.9 50.8 60.1 54.3 66.4 56.2 51.3 53.4 52.3 52.3 64.6 53.4 53.6 55.8 64.1 46.6 57.9 48 59.8 58.9 64.6 54.1 47.7 63.6 59.5 54.7 50.6 What is the test statistic for this sample? (Report answer accurate to three decimal places.)test statistic = What is the p-value for this sample? For this calculation, use the…arrow_forwardYou wish to test the following claim (HaHa) at a significance level of α=0.001α=0.001. Ho:μ1=μ2Ho:μ1=μ2 Ha:μ1≠μ2Ha:μ1≠μ2You obtain the following two samples of data. Sample #1 Sample #2 50.8 84.4 72.1 78.4 72.9 48.8 87.4 36.1 78.8 51.7 74.7 56.3 65.2 98.6 72.5 72.1 72.9 54.2 69.8 73.4 51.7 68.5 59.4 86.8 48.8 47.6 48.8 85.6 65.2 43.4 76.1 69.8 43.4 69.4 55.6 74.3 108.9 92.4 77.9 46.4 47.6 93.3 60 72.9 74.7 66.6 72 84.3 66.1 75 86.5 96.6 47.1 79.1 75 74.5 82.2 77.8 79.5 70.9 71.5 104.8 88.8 81.7 99.8 89.3 91.2 87.9 111.1 66.1 68 79.5 82.6 61.4 90.7 115.1 106.9 60.4 50.1 85.7 61.4 100.5 105.8 79.1 88.3 73 68.6 57.1 70.9 67.4 42.4 52.3 80.4 88.8 What is the test statistic for this sample? (Report answer accurate to three decimal places.)test statistic = What is the p-value for this sample? For this calculation, use the degrees of freedom reported from the technology you are using. (Report answer accurate to…arrow_forward
- (a) Find the critical value(s) assuming that the population variances are equal. (b) Find the critical value(s) assuming that the population variances are not equal.arrow_forwardAssume that both populations are normally distributed. (a) Test whether H1 #H2 at the a = 0.05 level of significance for the given sample data. (b) Construct a 95% confidence interval about u, - H2. Population 1 Population 2 13 13 14.1 11.8 4.2 3.1 (a) Test whether u, # H, at the a = 0.05 level of significance for the given sample data. Determine the null and alternative hypothesis for this test. O A. Ho:H1 # H2 H1:H1 = H2 O B. Ho:H1 = H2 H1:41 > H2 OC. Ho:H1 H2 H1:H1> H2 D. Ho:H1 = H2 H1:41 # H2 Detemine the P-value for this hypothesis test. P = (Round to three decimal places as needed.)arrow_forwardAssume that both populations are normally distributed. (a) Test whether μ₁ #₂ at the α = 0.05 level of significance for the given sample data. (b) Construct a 95% confidence interval about μ₁ − P2. H₁₁P2 OB. Ho P1 P2 H₁P₁ P₂ C. Ho H₁ xample H2 H₁ P₁ P2 D. Ho H₁ H2 H₁ H₁ H2 Detemine the P-value for this hypothesis test. P= (Round to three decimal places as needed.) Get more help. E n X S Population 1 12 10.2 2.6 Clear all Population 2 12 7.5 3arrow_forward
- Use the t-distribution and the sample results to complete the test of the hypotheses. Use a 5% significance level. Assume the results come from a random sample, and if the sample size is small, assume the underlying distribution is relatively normal.Test H0 : μ=15 vs Ha : μ>15 using the sample results x¯=17.2, s=6.4, with n=40. (a) Give the test statistic and the p-value.Round your answer for the test statistic to two decimal places and your answer for the p-value to three decimal places.test statistic = p-value =arrow_forwardUse the t-distribution table to find the critical value(s) for the indicated alternative hypotheses, level of significance a, and sample sizes n, and n. Assume that the samples are independent, normal, and random. Answer parts (a) and (b). Hg P2. a= 0.20, n, =6, n2 = 8 (a) Find the critical value(s) assuming that the population variances are equal. (Type an integer or decimal rounded to three decimal places as needed. Use a comma to separate answers as needed.) (b) Find the critical value(s) assuming that the population variances are not equal. (Type an integer or decimal rounded to three decimal places as needed. Use a comma to separate answers as needed.) Enter your answer in each of the answer boxes. DELLarrow_forwardUse the given statistics to complete parts (a) and (b). Assume that the populations are normally distributed. (a) Test whether u1 > H2 at the a = 0.01 level of significance for the given sample data. Population 1 Population 2 24 25 49.6 4.1 (b) Construct a 95% confidence interval about u1 - H2. 45.8 12.7 (a) Identify the null and alternative hypotheses for this test. B. Ho: H1 = H2 H1: H1>H2 O A. Ho: H1 = H2 O C. Ho: H1 + H2 H1: H1 = H2 H1: H1 #H2 O D. Ho: H1 H2 H1: H1 = H2 Find the test statistic for this hypothesis test. (Round to two decimal places as needed.)arrow_forward
arrow_back_ios
arrow_forward_ios
Recommended textbooks for you
- MATLAB: An Introduction with ApplicationsStatisticsISBN:9781119256830Author:Amos GilatPublisher:John Wiley & Sons Inc
 Probability and Statistics for Engineering and th...StatisticsISBN:9781305251809Author:Jay L. DevorePublisher:Cengage Learning
 Statistics for The Behavioral Sciences (MindTap C...StatisticsISBN:9781305504912Author:Frederick J Gravetter, Larry B. WallnauPublisher:Cengage Learning
  Elementary Statistics: Picturing the World (7th E...StatisticsISBN:9780134683416Author:Ron Larson, Betsy FarberPublisher:PEARSON
 The Basic Practice of StatisticsStatisticsISBN:9781319042578Author:David S. Moore, William I. Notz, Michael A. FlignerPublisher:W. H. Freeman
 Introduction to the Practice of StatisticsStatisticsISBN:9781319013387Author:David S. Moore, George P. McCabe, Bruce A. CraigPublisher:W. H. Freeman
MATLAB: An Introduction with Applications
Statistics
ISBN:9781119256830
Author:Amos Gilat
Publisher:John Wiley & Sons Inc
Probability and Statistics for Engineering and th...
Statistics
ISBN:9781305251809
Author:Jay L. Devore
Publisher:Cengage Learning
Statistics for The Behavioral Sciences (MindTap C...
Statistics
ISBN:9781305504912
Author:Frederick J Gravetter, Larry B. Wallnau
Publisher:Cengage Learning
Elementary Statistics: Picturing the World (7th E...
Statistics
ISBN:9780134683416
Author:Ron Larson, Betsy Farber
Publisher:PEARSON
The Basic Practice of Statistics
Statistics
ISBN:9781319042578
Author:David S. Moore, William I. Notz, Michael A. Fligner
Publisher:W. H. Freeman
Introduction to the Practice of Statistics
Statistics
ISBN:9781319013387
Author:David S. Moore, George P. McCabe, Bruce A. Craig
Publisher:W. H. Freeman