
MATLAB: An Introduction with Applications
6th Edition
ISBN: 9781119256830
Author: Amos Gilat
Publisher: John Wiley & Sons Inc
expand_more
expand_more
format_list_bulleted
Related questions
Question
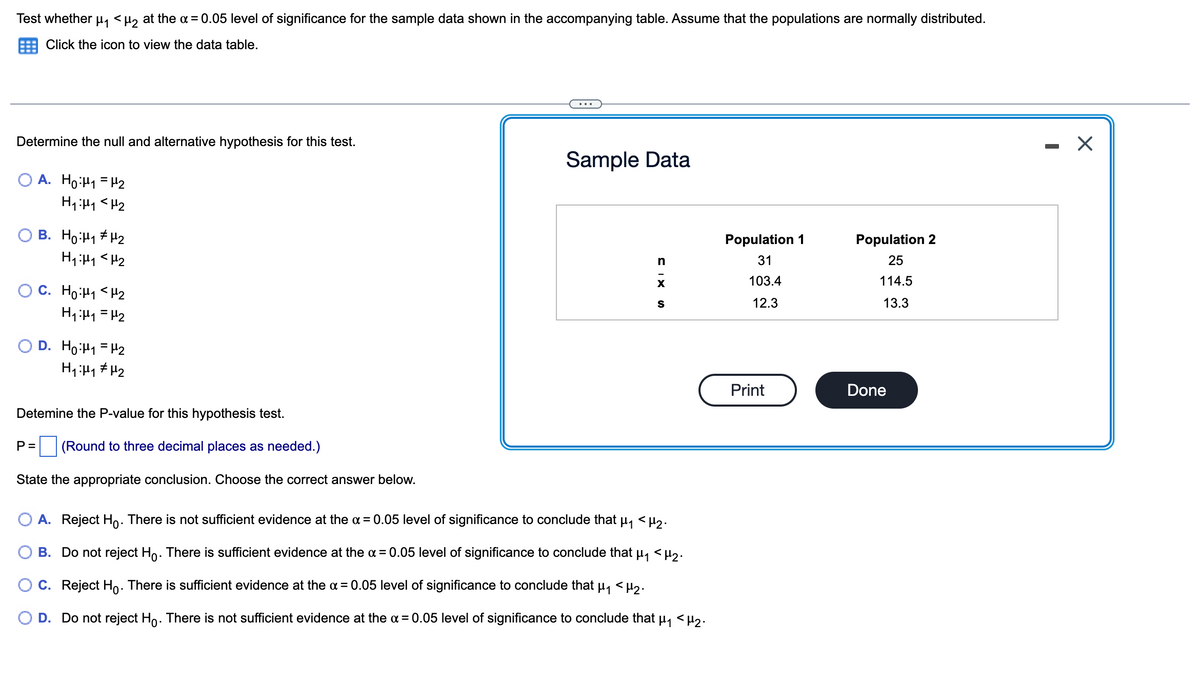

Transcribed Image Text:Test whether μ₁ <μ₂ at the α = 0.05 level of significance for the sample data shown in the accompanying table. Assume that the populations are normally distributed.
Click the icon to view the data table.
Determine the null and alternative hypothesis for this test.
A. Ho:₁ = ₂
H₁ H₁ <H₂
B. Ho:₁ ₂
H₁ H₁ H₂
P =
C. Ho:₁ <H₂
H₁:₁ = H₂
D. Ho:₁ = ₂
H₁ H₁ H₂
Detemine the P-value for this hypothesis test.
(Round to three decimal places as needed.)
State the appropriate conclusion. Choose the correct answer below.
Sample Data
n
S XIU
A. Reject Ho. There is not sufficient evidence at the α = 0.05 level of significance to conclude that H₁ <H₂.
B. Do not reject Ho. There is sufficient evidence at the x = 0.05 level of significance to conclude that µ₁ <µ₂.
C. Reject Ho. There is sufficient evidence at the α = 0.05 level of significance to conclude that μ₁ <μ₂.
D. Do not reject Ho. There is not sufficient evidence at the x = 0.05 level of significance to conclude that
H₁
<H2.
Population 1
31
103.4
12.3
Print
Population 2
25
114.5
13.3
Done
-
X
Expert Solution
This question has been solved!
Explore an expertly crafted, step-by-step solution for a thorough understanding of key concepts.

This is a popular solution

Trending nowThis is a popular solution!

Step by stepSolved in 5 steps with 13 images

Knowledge Booster

Similar questions
- Test the claim about the population mean, μ,at the given level of significance using the given sample statistics. Claim: μ=30 α=0.06 σ=3.64 Sample statistics: x=28.8, n=80arrow_forwardUse technology and a t-test to test the claim about the population mean μ at the given level of significance α using the given sample statistics. Assume the population is normally distributed. Claim: μ>79; α=0.10 Sample statistics: x=80.2, s=3.7, n=28 What are the null and alternative hypotheses? Choose the correct answer below. A. H0:μ≠79 HA:μ=79 B. H0:μ=79 HA:μ≠79 C. H0:μ≤79 HA:μ>79 D. H0:μ≥79 HA:μ<79 What is the value of the standardized test statistic?= What is the P-value of the test statistic?= Decide whether to reject or fail to reject the null hypothesis. Choose the correct answer below. A. Reject H0. There is enough evidence to support the claim. Your answer is correct. B. Reject H0. There is not enough evidence to support the claim. C. Fail to reject H0. There is enough evidence to support the claim. D. Fail to reject H0. There is not enough…arrow_forwardTest the claim below about the mean of the differences for a population of paired data at the level of significance x. Assume the samples are random and dependent, and the populations are normally distributed. Claim: μ ≥0; x = 0.10. Sample statistics: d= -2.4, s = 1.3, n = 19 Identify the null and alternative hypotheses. Choose the correct answer below. OA. Ho: Hd 0 The test statistic is t = (Round to two decimal places as needed.) The P-value is (Round to three decimal places as needed.) Since the P-value is the level of significance, C OB. Ho: Hd>0 Ha: Hd ≤0 O D. Ho: Hd #0 Ha: Hd = 0 OF. Ho: Hd 20 Ha: Hd <0 the null hypothesis. There statistically significant evidence to reject the claim.arrow_forward
- Test the claim about the population mean μ at the level of significance a. Assume the population is normally distributed. Claim: μ> 16; α = 0.05; G = 1.2 Sample statistics: x = 16.3, n=50 O A. Fail to reject Ho. There is not enough evidence at the 5% level of significance to support the claim. OB. Reject Ho. There is enough evidence at the 5% level of significance to support the claim. O C. There is not enough information to decide.arrow_forwardUse the t-distribution and the sample results to complete the test of the hypotheses. Use a 5% significance level. Assume the results come from a random sample, and if the sample size is small, assume the underlying distribution is relatively normal.Test H0 : μ=4 vs Ha : μ≠4 using the sample results x¯=4.8, s=2.3, with n=15. Give the test statistic and the p-value. What is the conclusion?arrow_forwardChoose the appropriate statistical test. When computing, be sure to round each answer as indicated. A dentist wonders if depression affects ratings of tooth pain. In the general population, using a scale of 1-10 with higher values indicating more pain, the average pain rating for patients with toothaches is 6.8. A sample of 30 patients that show high levels of depression have an average pain rating of 7.1 (variance 0.8). What should the dentist determine? 1. Calculate the estimated standard error. (round to 3 decimals). [st.error] 2. What is thet-obtained? (round to 3 decimals). 3. What is the t-cv? (exact value) 4. What is your conclusion? Only type "Reject" or Retain"arrow_forward
- Test the claim about the difference between two population means µ1 and µ2 at the level of significance a. Assume the samples are random and independent, and the populations are normally distributed. Claim: 41 = H2; a = 0.05. Assume o? =o; Sample statistics: x, = 31.8, s, = 3.4, n, = 12 and X2 = 34.7, s2 = 2.3, n2 = 1 Identify the null and alternative hypotheses. Choose the correct answer below. O A. Ho: H12H2 Ha: H1 H2 OF. Ho: H1> H2 Ha: H1 SH2 Find the standardized test statistic t. t=| (Round to two decimal places as needed.) Find the P-value. P= (Round to three decimal places as needed.) Decide whether to reject or fail to reject the null hypothesis and interpret the decision in the context of the original claim. Ho. There enough evidence at the 5% level of significance to reject the claim.arrow_forwardAssume that you want to test the claim that the paired sample data come from a population for which the mean difference is µd = 0. x / 734 13 y / 99 8 7 13 Compute the value of the test statistic. (Round your answer to nearest hundredth. Hint: The correct test statistic is positive.)arrow_forwardUse technology and a t-test to test the claim about the population mean μ at the given level of significance & using the given sample statistics. Assume the population is normally distributed. Claim: μ> 73; x = 0.10 Sample statistics: x = 75.9, s = 2.8, n = 28 What are the null and alternative hypotheses? Choose the correct answer below. A. Ho: μ ≥73 HA: μ73 D. Ho: μ = 73 HA: μ#73arrow_forward
arrow_back_ios
arrow_forward_ios
Recommended textbooks for you
- MATLAB: An Introduction with ApplicationsStatisticsISBN:9781119256830Author:Amos GilatPublisher:John Wiley & Sons Inc
 Probability and Statistics for Engineering and th...StatisticsISBN:9781305251809Author:Jay L. DevorePublisher:Cengage Learning
 Statistics for The Behavioral Sciences (MindTap C...StatisticsISBN:9781305504912Author:Frederick J Gravetter, Larry B. WallnauPublisher:Cengage Learning
  Elementary Statistics: Picturing the World (7th E...StatisticsISBN:9780134683416Author:Ron Larson, Betsy FarberPublisher:PEARSON
 The Basic Practice of StatisticsStatisticsISBN:9781319042578Author:David S. Moore, William I. Notz, Michael A. FlignerPublisher:W. H. Freeman
 Introduction to the Practice of StatisticsStatisticsISBN:9781319013387Author:David S. Moore, George P. McCabe, Bruce A. CraigPublisher:W. H. Freeman
MATLAB: An Introduction with Applications
Statistics
ISBN:9781119256830
Author:Amos Gilat
Publisher:John Wiley & Sons Inc
Probability and Statistics for Engineering and th...
Statistics
ISBN:9781305251809
Author:Jay L. Devore
Publisher:Cengage Learning
Statistics for The Behavioral Sciences (MindTap C...
Statistics
ISBN:9781305504912
Author:Frederick J Gravetter, Larry B. Wallnau
Publisher:Cengage Learning
Elementary Statistics: Picturing the World (7th E...
Statistics
ISBN:9780134683416
Author:Ron Larson, Betsy Farber
Publisher:PEARSON
The Basic Practice of Statistics
Statistics
ISBN:9781319042578
Author:David S. Moore, William I. Notz, Michael A. Fligner
Publisher:W. H. Freeman
Introduction to the Practice of Statistics
Statistics
ISBN:9781319013387
Author:David S. Moore, George P. McCabe, Bruce A. Craig
Publisher:W. H. Freeman