MATLAB: An Introduction with Applications
6th Edition
ISBN: 9781119256830
Author: Amos Gilat
Publisher: John Wiley & Sons Inc
expand_more
expand_more
format_list_bulleted
Question

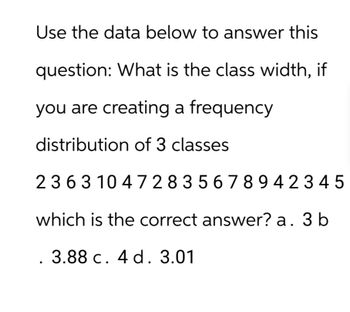
Transcribed Image Text:Use the data below to answer this
question: What is the class width, if
you are creating a frequency
distribution of 3 classes
2363 104 728 35678942345
which is the correct answer? a. 3 b
3.88 c. 4 d. 3.01
Expert Solution
This question has been solved!
Explore an expertly crafted, step-by-step solution for a thorough understanding of key concepts.
Step by stepSolved in 3 steps with 4 images

Knowledge Booster
Similar questions
- A sample of 15 boy scouts was selected and their weights (in pounds) were recorded in the table below. Construct a frequency distribution to answer the following questions. 97 120 137 124 117 108 134 126 123 106 130 110 100 120 140 a. Using the class width of 10 give the upper and lower limit for five classes, starting with lower limit of 95 for the first class b. Construct a frequency distribution for the dataarrow_forwardHere is a data set: 262 143 161 311 307 150 234 204 174 210 128 273 228 183 184 260 128 243 209 311 190 169 197 179 190 155 188 311 Construct a grouped frequency distribution table (GFDT) for this data set. You want 10 classes with a "nice" class width. Each class contains its lower class limit, and the lower class limits should all be multiples of the class width. Note: the data ranges will be hand graded after the due date for this assignment. If your frequencies are marked correct, you most likely have the classes correct.arrow_forwardTen cyclists were each asked the distance in miles they biked last week. Their responses are given below. Complete the grouped frequency distribution for the data. In the distribution, the frequency of a class is the number of distances in that class. (Note that we are using a class width of 5.) Distance in miles Distance in miles Frequency ✗ 10 14 17 9 3 1 to 5 ☐ 14 20 14 9 15 6 to 10 11 to 15 16 to 20arrow_forward
- After recording the final grade (A, B, C, D, E) for each individual in a class of n = 26 students, the professor would like to display the grade distribution in a frequency distribution graph. What kind of graph should be used? Question 15 options: A bar graph A histogram A polygon Either a histogram or a polygonarrow_forwardThe following are the grades received on an paper by 25 students. 97 97 98 40 45 77 65 65 65 68 81 93 68 71 87 85 88 76 79 78 87 81 81 83 89 a) Fill in the frequency table below using the data given. Use 10-point bins. Note: You may have rows left over. Grade Frequency Relative Frequency Cumulative Frequency Total: b) Draw a histogram based on the frequency table in part a . Don’t forget to label properly the axes, and put a title.arrow_forwardUsing 6 classes of width 50 starting at 100, construct a frequency distribution for the following numbers. 253 203 213 271 379 291 111 359 385 367 365 201 295 339arrow_forward
arrow_back_ios
arrow_forward_ios
Recommended textbooks for you
 MATLAB: An Introduction with ApplicationsStatisticsISBN:9781119256830Author:Amos GilatPublisher:John Wiley & Sons Inc
 Probability and Statistics for Engineering and th...StatisticsISBN:9781305251809Author:Jay L. DevorePublisher:Cengage Learning
 Statistics for The Behavioral Sciences (MindTap C...StatisticsISBN:9781305504912Author:Frederick J Gravetter, Larry B. WallnauPublisher:Cengage Learning
 Elementary Statistics: Picturing the World (7th E...StatisticsISBN:9780134683416Author:Ron Larson, Betsy FarberPublisher:PEARSON
 The Basic Practice of StatisticsStatisticsISBN:9781319042578Author:David S. Moore, William I. Notz, Michael A. FlignerPublisher:W. H. Freeman
 Introduction to the Practice of StatisticsStatisticsISBN:9781319013387Author:David S. Moore, George P. McCabe, Bruce A. CraigPublisher:W. H. Freeman

MATLAB: An Introduction with Applications
Statistics
ISBN:9781119256830
Author:Amos Gilat
Publisher:John Wiley & Sons Inc

Probability and Statistics for Engineering and th...
Statistics
ISBN:9781305251809
Author:Jay L. Devore
Publisher:Cengage Learning

Statistics for The Behavioral Sciences (MindTap C...
Statistics
ISBN:9781305504912
Author:Frederick J Gravetter, Larry B. Wallnau
Publisher:Cengage Learning

Elementary Statistics: Picturing the World (7th E...
Statistics
ISBN:9780134683416
Author:Ron Larson, Betsy Farber
Publisher:PEARSON

The Basic Practice of Statistics
Statistics
ISBN:9781319042578
Author:David S. Moore, William I. Notz, Michael A. Fligner
Publisher:W. H. Freeman

Introduction to the Practice of Statistics
Statistics
ISBN:9781319013387
Author:David S. Moore, George P. McCabe, Bruce A. Craig
Publisher:W. H. Freeman