Concept explainers
QUESTION:
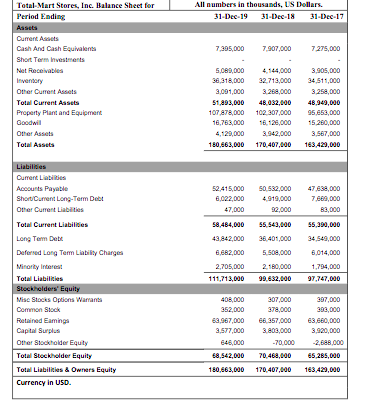
Calculate Market Value of Debt
Additional Info:
Analysts expect the firm’s revenues, earnings, capital expenditures, and
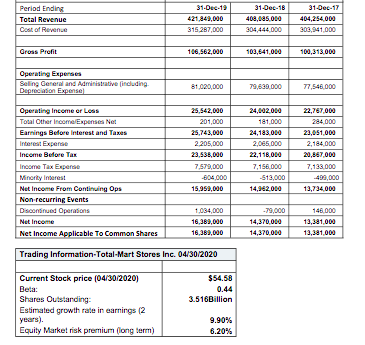
The depreciation expense for 2019 is $5.182 billion.
Capital spending is expected to offset depreciation in the stable state period.
The yield on 30-year treasury bonds is 2% and the equity market risk premium is 6.2%.
The shares outstanding as of 12/31/2019 were 3,516,000,000 and the stock price was $60 per share.
The average price of the company’s long-term corporate Bonds was 123.95 with an average yield to maturity of 4.16%. The company’s long-term bonds have a bond rating of AA.
| Shares Outstanding | 3,516,000,000 |
| Stock Price | $60 |
| Yield (30Y Treasury) | 2% |
| Equity Market Risk Prem. | 6.2% |
| Avg. Price LT Corp. Bond | 123.95 |
| Avg. YTM | 4.16% |
| Depreciation Expense (2019) | 5,182,000,000 |
| Current Stock Price | 54.58 |
| Beta | 0.44 |
| Shares Outstanding | 3,516,000,000 |
| Estimated Growth Rate in Earnings (2Y) | 9.9 |
| Equity Market Risk Prem. | 6.2% |


Trending nowThis is a popular solution!
Step by stepSolved in 2 steps with 2 images

- Suppose today that you have the following information: yield on 10-year TIPS: 3.5% yield on 10-year Treasury note: 3.0% What is the expected annual rate of inflation (approximate) over the next 10 years?arrow_forwardDeterminant of Interest Rates The real risk-free rate of interest is 4%. Inflation is expected to be 1% this year and 5% during each of the next 2 years. Assume that the maturity risk premium is zero. What is the yield on 2-year Treasury securities? Round your answer to two decimal places. % What is the yield on 3-year Treasury securities? Round your answer to two decimal places.arrow_forwardBased on economists' forecasts and analysis, 1-year Treasury bill rates and liquidity premiums for the next four years are expected to be as follows: R₁ = 0.55% R1 E(21) = 1.70% = 42 = 0.08% E(31) 1.80% 43 = L4= 0.12% 0.14% = E(41) 2.10% Using the liquidity premium theory, determine the current (long-term) rates. Note: Do not round intermediate calculations. Round your percentage answers to 2 decimal places (i.e., 0.1234 should be entered as 12.34). Current (Long-term) Rates Years 1 % 2 % 3 % 4 5 %arrow_forward
- You Answered orrect Answer A company is promising a coupon payment of $46 in 2.03 years. A risk free government bond of the same maturity is yielding 1.66% per year. The credit spread for the promised payment by the company is 1.24% per year. Both the yield and the spread are stated on a continuously compounded basis. What is the present value of the expected loss on the promised payment? 1.11 margin of error +/-50arrow_forwardBond valuation - Quarterly interest Calculate the value of a $1,000-par-value bond paying quarterly interest at an annual coupon interest rate of 12% and having 11 years until maturity if the required return on similar-risk bonds is currently a 16% annual rate.arrow_forwardBased on economists' forecasts and analysis, 1-year Treasury bill rates and liquidity premiums for the next four years are expected to be as follows: 0.80% = 1.95% R1 E(201) E(371) = $2.05% E(471) 2.35% L2= 0.07% L3= 0.11% L4= 0.13% Using the liquidity premium theory, determine the current (long-term) rates. (Do not round intermediate calculations. Round your answers to 2 decimal places.) Years 1 2 3 4 Current (Long-term) Rates % % % %arrow_forward
- Bhupatbhaiarrow_forwardok Based on economists' forecasts and analysis, 1-year Treasury bill rates and liquidity premiums for the next four years are expected to be as follows: R1 = 1.00% = 2.15% 2.25% = 2.55% E(21) E(31) = E(471) 42 = L3 = L4 = Using the liquidity premium theory, determine the current (long-term) rates. 0.05% 0.10% 0.12% nel plecor (in 01234 should be enteredarrow_forwardView Policies Current Attempt in Progress Carla Vista, Inc., has four-year bonds outstanding that pay a coupon rate of 7.0 percent and make coupon payments semiannually. If these bonds are currently selling at $921.69. What is the yield to maturity that an investor can expect to earn on these bonds? Assume face value is $1,000. (Round answer to 1 decimal place, e.g. 15.2%) Yield to maturity % What is the effective annual yield? (Round answer to 1 decimal place, eg. 15.2%) Effective annual yield. %arrow_forward
 Essentials Of InvestmentsFinanceISBN:9781260013924Author:Bodie, Zvi, Kane, Alex, MARCUS, Alan J.Publisher:Mcgraw-hill Education,

 Foundations Of FinanceFinanceISBN:9780134897264Author:KEOWN, Arthur J., Martin, John D., PETTY, J. WilliamPublisher:Pearson,
 Fundamentals of Financial Management (MindTap Cou...FinanceISBN:9781337395250Author:Eugene F. Brigham, Joel F. HoustonPublisher:Cengage Learning
 Corporate Finance (The Mcgraw-hill/Irwin Series i...FinanceISBN:9780077861759Author:Stephen A. Ross Franco Modigliani Professor of Financial Economics Professor, Randolph W Westerfield Robert R. Dockson Deans Chair in Bus. Admin., Jeffrey Jaffe, Bradford D Jordan ProfessorPublisher:McGraw-Hill Education


