MATLAB: An Introduction with Applications
6th Edition
ISBN: 9781119256830
Author: Amos Gilat
Publisher: John Wiley & Sons Inc
expand_more
expand_more
format_list_bulleted
Question
thumb_up100%

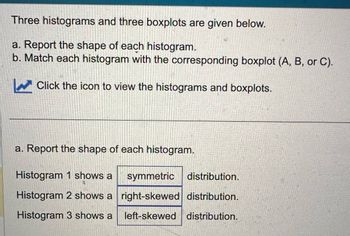
Transcribed Image Text:Three histograms and three boxplots are given below.
a. Report the shape of each histogram.
b. Match each histogram with the corresponding boxplot (A, B, or C).
Click the icon to view the histograms and boxplots.
a. Report the shape of each histogram.
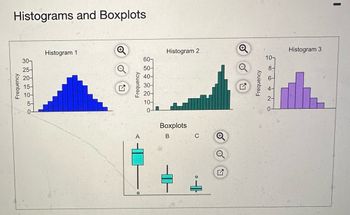
Histogram 1 shows a symmetric distribution.
Histogram 2 shows a right-skewed distribution.
Histogram 3 shows a left-skewed distribution.

Transcribed Image Text:Frequency
Histograms and Boxplots
Histogram 1
Q
Histogram 2
Q
Histogram 3
30-
60-
10-
25-
50-
8-
20-
15-
10-
5-
0-
Frequency
40-
30-
20-
Frequency
6-
10-
UTO
2-
0-
A
Boxplots
B
C
Q
Expert Solution
This question has been solved!
Explore an expertly crafted, step-by-step solution for a thorough understanding of key concepts.
Step by stepSolved in 2 steps

Knowledge Booster
Similar questions
- Find the mean of the following data set. Assume the data set is a sample. Round your answer to the nearest hundredth, if necessary. 30 45 35 37, 38, 38, 39, 33, 33, 36, 32, 26, 43, 30 20arrow_forwardA County Board of Supervisors has appointed an urban planning committee to evaluate proposed community development projects. The committee is analyzing, among other things, data on household incomes in two cities within the county. They have collected data on the income of 80 households in each of the two cities. The histograms below show the distributions of the two sets of incomes (in thousands of dollars). Each histogram shows household income on the horizontal axis and number of households on the vertical axis. The means and standard deviations for the data sets are also given. City A City B 25- 25 - 20+ 20- 15- 15- 10+ 10- 5+ 5- 0- 10 20 30 40 50 60 70 80 90 100 10 20 30 40 50 60 70 80 90 100 City A mean: 38.13 thousand dollars City B mean: 55.13 thousand dollars City A standard deviation: 20.84 thousand dollars City B standard deviation: 14.71 thousand dollars The committee wants to use the Empirical Rule to make some approximations about both data sets. Unfortunately, it is…arrow_forwardFind the (a) mean, (b) median, (c) mode, and (d) midrange for the data and then (e) answer the given question. Listed below are the jersey numbers of 11 players randomly selected from the roster of a championship sports team. What do the results tell us? 61 51 5 73 85 37 41 6 59 82 18 a. Find the mean. b. Find the median. c. Find the mode. d. Find the midrange. e. What do the results tell us?arrow_forward
- Under each Histogram, write a comment about the shape of the distribution (for example, Symmetric, Skewed (left/right), Uniform or Irregular) Students Frequency Frequency of Students 9 1 0 9 8 1 0 2.0 2.40 1 2 Histogram of Students College GPA 9 2.4 6 4 2.56 Histogram of Students Predicted GPA 9 4 2.8 College GPA 3 2 2.72 Predicted GPA 3.2 3 2.88 3 3 2 3.6 3.04arrow_forwardFind the variance for the following data 72,62,52,45 Round to three decimal placesarrow_forwardFor the sample scores in the frequency distribution table below, the median is 1 4 4. 1 1 1 3.arrow_forward
- A County Board of Supervisors has appointed an urban planning committee to evaluate proposed community development projects. The committee is analyzing, among other things, data on household incomes in two cities within the county. They have collected data on the income of 77 households in each of the two cities. The histograms below show the distributions of the two sets of incomes (in thousands of dollars). Each histogram shows household income on the horizontal axis and number of households on the vertical axis. The means and standard deviations for the data sets are also given. City A City B 25+ 20+ 15+ 10+ 5- ← 10 20 30 40 50 60 70 80 90 100 City A mean: 73.96 thousand dollars City A standard deviation: 20.30 thousand dollars Explanation 25- 20- 15- 104 5+ 10 (a) Identify the data set for which it is appropriate to use the Empirical Rule. It is appropriate to use the Empirical Rule for the (Choose one) ▼ data set. 20 30 The committee wants to use the Empirical Rule to make some…arrow_forwardGiven the following distribution of scores: 2, 8, 2, 3, 6, 5, 7, 8, 4, 8, 2, 3 What is the mean of the distribution? Group of answer choices 5.8 5.2 4.8 4.4arrow_forwardGiven the following distribution of scores: 2, 8, 2, 3, 6, 5, 7, 8, 4, 8, 2, 3 What is the mode of the distribution? Group of answer choices 2 8 Both 5 and 7 Both 2 and 8arrow_forward
- Consider the GPA of students in class: 1.6,1.7,1.8,1.9,2.4,2.6,2.7,2.8,2.9,3.2,3.3,3.3,3.4,4.0,4.0,4.0,4.0 Construct a stem-and-leaf plot. The leaves corresponding to stem 4 are? What is the rough shape of this data? Please answer both questionsarrow_forwardA teacher surveyed 11 students for how many days per week they have read newspaper. The result is shown as follows: 1 1 1 2 2 2 2 5 6 6 6 (a) Find the mean. (b) Find the median. (c) Find the mode.arrow_forward
arrow_back_ios
arrow_forward_ios
Recommended textbooks for you
 MATLAB: An Introduction with ApplicationsStatisticsISBN:9781119256830Author:Amos GilatPublisher:John Wiley & Sons Inc
 Probability and Statistics for Engineering and th...StatisticsISBN:9781305251809Author:Jay L. DevorePublisher:Cengage Learning
 Statistics for The Behavioral Sciences (MindTap C...StatisticsISBN:9781305504912Author:Frederick J Gravetter, Larry B. WallnauPublisher:Cengage Learning
 Elementary Statistics: Picturing the World (7th E...StatisticsISBN:9780134683416Author:Ron Larson, Betsy FarberPublisher:PEARSON
 The Basic Practice of StatisticsStatisticsISBN:9781319042578Author:David S. Moore, William I. Notz, Michael A. FlignerPublisher:W. H. Freeman
 Introduction to the Practice of StatisticsStatisticsISBN:9781319013387Author:David S. Moore, George P. McCabe, Bruce A. CraigPublisher:W. H. Freeman

MATLAB: An Introduction with Applications
Statistics
ISBN:9781119256830
Author:Amos Gilat
Publisher:John Wiley & Sons Inc

Probability and Statistics for Engineering and th...
Statistics
ISBN:9781305251809
Author:Jay L. Devore
Publisher:Cengage Learning

Statistics for The Behavioral Sciences (MindTap C...
Statistics
ISBN:9781305504912
Author:Frederick J Gravetter, Larry B. Wallnau
Publisher:Cengage Learning

Elementary Statistics: Picturing the World (7th E...
Statistics
ISBN:9780134683416
Author:Ron Larson, Betsy Farber
Publisher:PEARSON

The Basic Practice of Statistics
Statistics
ISBN:9781319042578
Author:David S. Moore, William I. Notz, Michael A. Fligner
Publisher:W. H. Freeman

Introduction to the Practice of Statistics
Statistics
ISBN:9781319013387
Author:David S. Moore, George P. McCabe, Bruce A. Craig
Publisher:W. H. Freeman