
MATLAB: An Introduction with Applications
6th Edition
ISBN: 9781119256830
Author: Amos Gilat
Publisher: John Wiley & Sons Inc
expand_more
expand_more
format_list_bulleted
Related questions
Concept explainers
Question

Transcribed Image Text:54
10
20 30 40
50
60
70 80
90
100
10
20
30
40
50
60
70
80
90
100
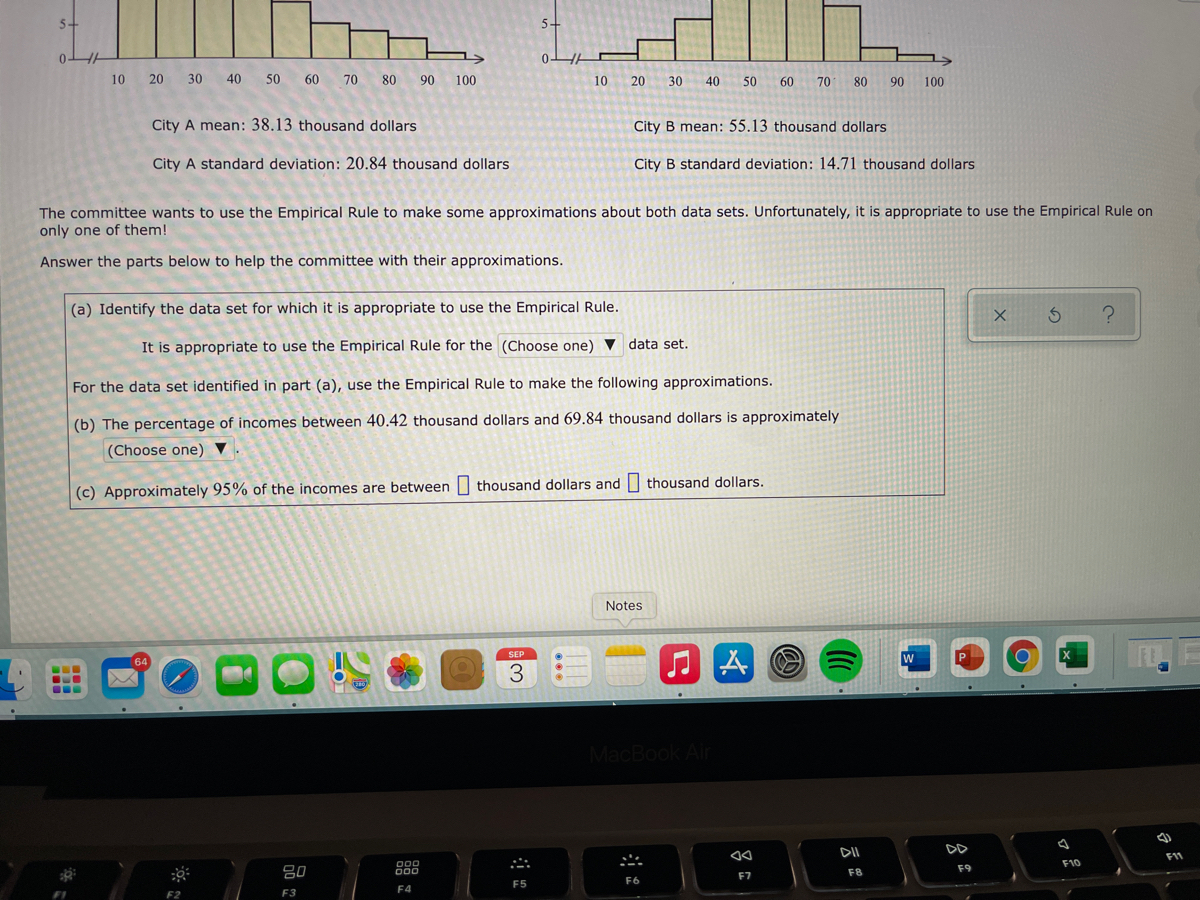
City A mean: 38.13 thousand dollars
City B mean: 55.13 thousand dollars
City A standard deviation: 20.84 thousand dollars
City B standard deviation: 14.71 thousand dollars
The committee wants to use the Empirical Rule to make some approximations about both data sets. Unfortunately, it is appropriate to use the Empirical Rule on
only one of them!
Answer the parts below to help the committee with their approximations.
(a) Identify the data set for which it is appropriate to use the Empirical Rule.
It is appropriate to use the Empirical Rule for the (Choose one) V data set.
For the data set identified in part (a), use the Empirical Rule to make the following approximations.
(b) The percentage of incomes between 40.42 thousand dollars and 69.84 thousand dollars is approximately
(Choose one) ▼
(c) Approximately 95% of the incomes are between thousand dollars and thousand dollars.
Notes
SEP
W
MacBook Air
DII
DD
F1
F10
80
888
F8
F7
F6
F5
F4
F3

Transcribed Image Text:A County Board of Supervisors has appointed an urban planning committee to evaluate proposed community development projects. The committee is analyzing,
among other things, data on household incomes in two cities within the county. They have collected data on the income of 80 households in each of the two
cities. The histograms below show the distributions of the two sets of incomes (in thousands of dollars). Each histogram shows household income on the
horizontal axis and number of households on the vertical axis. The means and standard deviations for the data sets are also given.
City A
City B
25-
25 -
20+
20-
15-
15-
10+
10-
5+
5-
0-
10
20
30
40
50
60 70
80
90
100
10
20
30
40
50
60
70
80
90
100
City A mean: 38.13 thousand dollars
City B mean: 55.13 thousand dollars
City A standard deviation: 20.84 thousand dollars
City B standard deviation: 14.71 thousand dollars
The committee wants to use the Empirical Rule to make some approximations about both data sets. Unfortunately, it is appropriate to use the Empirical Rule on
only one of them!
Answer the parts below to help the committee with their approximations.
(a) Identify the data set for which it is appropriate to use the Empirical Rule.
It is appropriate to use the Empirical Rule for the (Choose one) V data set.
For the data set identified in part (a), use the Empirical Rule to make the followir Music imations.
64
SEP
A の
w
3
W
...
Expert Solution
This question has been solved!
Explore an expertly crafted, step-by-step solution for a thorough understanding of key concepts.

This is a popular solution

Trending nowThis is a popular solution!

Step by stepSolved in 4 steps

Knowledge Booster


Learn more about
Need a deep-dive on the concept behind this application? Look no further. Learn more about this topic, statistics and related others by exploring similar questions and additional content below.Similar questions
- The scores on the Accuplacer test and High School GPAs are normally distributed.The Accuplacer test had a mean of 40 and a standard deviation of 8.High School GPAs had a mean of 2.6 and a standard deviation of 0.2.What high school GPA do you need to equal a score of 28 on the Accuplacer test?Give answer to two decimal places.arrow_forwardWe want to compare cholesterol levels between men and women, so we collect a sample of 20 women and 30 men. The group of men in our sample have a mean of 240.0 with standard deviation 35.0, and the women have a mean of 210.0 with standard deviation 30.0. If we reject the null hypothesis, then what is our conclusion? Group of answer choices The mean cholesterol levels are the same between men and women The mean cholesterol levels are different between men and womenarrow_forwardCan you help me determine the P value for the following equation? I received 0.528 (rounded 3 decimal places) for my answer but it stated that it was incorrect. I utilized the Ti-84 calculator for my answer.arrow_forward
- Hi, I'm struggling with this question and the steps on how to solve the answerarrow_forwardQuestion H: Do the results of Question F agree with Chebychev's Theorem? Explain. You can type your answer with equations and formulas for this question. (Question F attached in second photo with answer)arrow_forwardYou wish to test the following claim (H.) at a significance level of a= 0.002. For the context of this problem, = P2-A where the first data set represents a pre-test and the second data set represents a post-test. H. = 0 You believe the population of difference scores is normally distributed, but you do not know the standard deviation You obtain pre-test and post-test samples for n = 10 subjects. The average difference (post - pre) is d -32.1 with a standard deviation of the differences of sa = 36.7.arrow_forward
- Company A claims that their product is more consistent than the competition, Company B. We have been collecting data from Company B for many years and feel certain that Company B has a mean of μ=23.5 and a standard deviation of σ=0.43. We wish to perform an α=0.05 level test. We now collect 10 pieces of data from Company A. The mean of that data is 24.6 and the standard deviation of that data is 0.36. What is your data value (test statistic) for this problem (3-decimal place)? What is your chart number for this problem?arrow_forwardCan you please answer number 2 and all of the sub problems and show all of the steps to the solutionarrow_forwardI need help with all parts of this question 12arrow_forward
- question(3): Anar scored 78 on a test that had a mean of 72 and a standard deviation of 2.7 . Omid score 66 that had a standard deviation of 1.3 (a) What is Anar Z score? (b)What is Omid z score? (c)Which Is higher Anar or Omid?arrow_forwardQuestion 2 Save On a history test Patrick received a grade of 43 out of 50. The class mean was 35 with a standard deviation of 6. His girlfriend Kristin, in another section, received a grade of 87 out of 100. Her class mean was 75 with a standard deviation of 10. z-score for Patrick's grade (round to two decimal places) z-score for Kristin's grade = (round to two decimal places) Who received the higher grade relative to their respective classes? Why?arrow_forwardHey, can you show me how to calculate part B in the attached problem?arrow_forward
arrow_back_ios
SEE MORE QUESTIONS
arrow_forward_ios
Recommended textbooks for you
- MATLAB: An Introduction with ApplicationsStatisticsISBN:9781119256830Author:Amos GilatPublisher:John Wiley & Sons Inc
 Probability and Statistics for Engineering and th...StatisticsISBN:9781305251809Author:Jay L. DevorePublisher:Cengage Learning
 Statistics for The Behavioral Sciences (MindTap C...StatisticsISBN:9781305504912Author:Frederick J Gravetter, Larry B. WallnauPublisher:Cengage Learning
  Elementary Statistics: Picturing the World (7th E...StatisticsISBN:9780134683416Author:Ron Larson, Betsy FarberPublisher:PEARSON
 The Basic Practice of StatisticsStatisticsISBN:9781319042578Author:David S. Moore, William I. Notz, Michael A. FlignerPublisher:W. H. Freeman
 Introduction to the Practice of StatisticsStatisticsISBN:9781319013387Author:David S. Moore, George P. McCabe, Bruce A. CraigPublisher:W. H. Freeman
MATLAB: An Introduction with Applications
Statistics
ISBN:9781119256830
Author:Amos Gilat
Publisher:John Wiley & Sons Inc
Probability and Statistics for Engineering and th...
Statistics
ISBN:9781305251809
Author:Jay L. Devore
Publisher:Cengage Learning
Statistics for The Behavioral Sciences (MindTap C...
Statistics
ISBN:9781305504912
Author:Frederick J Gravetter, Larry B. Wallnau
Publisher:Cengage Learning
Elementary Statistics: Picturing the World (7th E...
Statistics
ISBN:9780134683416
Author:Ron Larson, Betsy Farber
Publisher:PEARSON
The Basic Practice of Statistics
Statistics
ISBN:9781319042578
Author:David S. Moore, William I. Notz, Michael A. Fligner
Publisher:W. H. Freeman
Introduction to the Practice of Statistics
Statistics
ISBN:9781319013387
Author:David S. Moore, George P. McCabe, Bruce A. Craig
Publisher:W. H. Freeman