
MATLAB: An Introduction with Applications
6th Edition
ISBN: 9781119256830
Author: Amos Gilat
Publisher: John Wiley & Sons Inc
expand_more
expand_more
format_list_bulleted
Related questions
Question
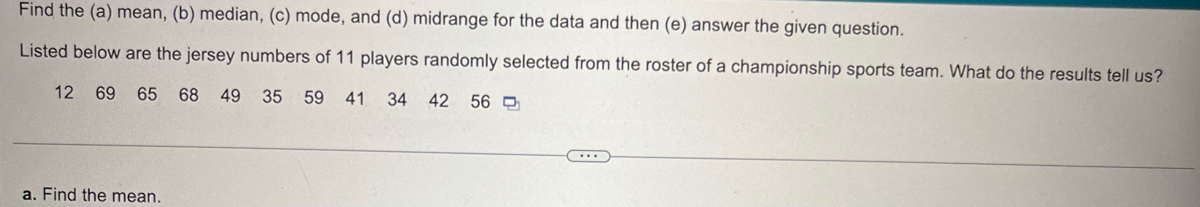

Transcribed Image Text:Find the (a) mean, (b) median, (c) mode, and (d) midrange for the data and then (e) answer the given question.
Listed below are the jersey numbers of 11 players randomly selected from the roster of a championship sports team. What do the results tell us?
12 69 65 68 49 35 59 41 34 42 56
a. Find the mean.
Expert Solution
This question has been solved!
Explore an expertly crafted, step-by-step solution for a thorough understanding of key concepts.

Step by stepSolved in 2 steps with 2 images

Knowledge Booster

Similar questions
- Find the (a) mean, (b) median, (c) mode, and (d) midrange for the data and then (e) answer the given question. Listed below are the amounts (dollars) it costs for marriage proposal packages at different sports venues. Are there any outliers? 49 60 60 65 65 184 200 200 300 65 85 95 100 115 150 150 325 375 450 450 450 450 2500 3000 a. Find the mean. The mean is $ (Type an integer or a decimal rounded to two decimal places as needed.) b. Find the median. The median is $ (Type an integer or a decimal rounded to two decimal places as needed.) c. Find the mode. Select the correct choice below and, if necessary, fill in the answer box to complete your choice. A. The mode(s) is(are) $ (Type an integer or a decimal. Do not round. Use a comma to separate answers as needed.) B. There is no mode. d. Find the midrange. The midrange is $. (Type an integer or a decimal rounded to two decimal places as needed.) e. Are there any outliers? Choose the correct answer below. O A. There do not appear to be…arrow_forwardThe table shows, for four cruises, the numbers of crew members, passengers, and entertainers (not included as passengers). Find (a) the mean and (b) the median total number of persons per cruise. Cruise Cruise 1 Cruise 2 Cruise 3 Cruise 4 Crew Passengers 1600 3400 1300 2500 183 225 177 213 Entertainers 40 75 10 55arrow_forwardThe tuition and fees (in thousands of dollars) for the top 14 universities in a recent year are listed below. Find the mean, median, and mode of the data, if possible. If any of these measures cannot be found or a measure does not represent the center of the data, explain why. 39 43 43 47 43 35 41 41 47 47 46 43 43 41 Find the mode of the costs. Select the correct choice below and, if necessary, fill in the answer box to complete your choice. OA. The mode(s) of the costs is (are). (Round to one decimal place as needed. Use a comma to separate answers as needed.) B. There is no mode. Does (Do) the mode(s) represent the center of the data? A. The mode(s) represent(s) the center. B. The mode(s) does (do) not represent the center because it (they) is (are) not a data value. C. There is no mode. D. The mode(s) does (do) not represent the center because it (one) is the smallest data value. O E. The mode(s) does (do) not represent the center because it (one) is the largest data value.arrow_forward
- Find the (a) mean, (b) median, (c) mode, and (d) midrange for the data and then (e) answer the given question. Listed below are the jersey numbers of 11 players randomly selected from the roster of a championship sports team. What do the results tell us? 15 17 54 61 13 72 58 5 14 22 1arrow_forwardThe tuition and fees (in thousands of dollars) for the top 14 universities in a recent year are listed below. Find the mean, median, and mode of the data, if possible. If any of these measures cannot be found or a measure does not represent the center of the data, explain why. 44 42 39 42 46 44 47 44 44 35 42 46 46 44 Find the mean cost. Select the correct choice below and, if necessary, fill in the answer box to complete your choice. 000 A. The mean cost is 43.2. (Round to one decimal place as needed.) B. There is no mean cost. Does the mean represent the center of the data? A. The mean represents the center. B. The mean does not represent the center because it is the smallest data value. OC. The mean does not represent the center because it is the largest data value. D. The mean does not represent the center because it is not a data value. OE. There is no mean cost.arrow_forwardNumber of text messages received during the class for 5 students are given below. 5 2 5 4 a. Find the mean. b. Find the median. c. Find the range. Enter the answers in the same order.arrow_forward
- Find the (a) mean, (b) median, (c) mode, and (d) midrange for the data and then (e) answer the given question. Listed below are the weights in pounds of 11 players randomly selected from the roster of a championship sports team. Are the results likely to be representative of all players in that sport's league? 308 309 223 217 274 270 199 238 308 283 199 a. Find the mean. The mean is pound(s). (Type an integer or a decimal rounded to one decimal place as needed.)arrow_forwardFind the (a) mean, (b) median, (c) mode, and (d) midrange for the data and then (e) answer the given question. Listed below are the amounts (dollars) it costs for marriage proposal packages at different sports venues. Are there any outliers? 49 60 60 184 200 200 a. Find the mean. 60 65 65 85 95 100 105 150 150 175 300 325 375 400 400 400 400 2000 2500 The mean is $ (Type an integer or a decimal rounded to two decimal places as needed.) b. Find the median. The median is $ (Type an integer or a decimal rounded to two decimal places as needed.) c. Find the mode. Select the correct choice below and, if necessary, fill in the answer box to complete your choice. A. The mode(s) is(are) $ (Type an integer or a decimal. Do not round. Use a comma to separate answers as needed.) B. There is no mode. d. Find the midrange. The midrange is $ (Type an integer or a decimal rounded to two decimal places as needed.) e. Are there any outliers? Choose the correct answer below. A. There do not appear to be…arrow_forwardWe are going to calculate the mean, median, and mode for two sets of data. Please show your answer to one decimal place if necessary.Here is the first data set. 48 78 53 22 45 42 61 97 87 22 54 what is the mean (¯xx¯) of this data set? What is the median of this data set? What is the mode of this data set? Here is the second data set. 49 84 44 89 74 26 80 39 92 49 What is the mean (¯xx¯) of this data set? What is the median of this data set? What is the mode of this data set?arrow_forward
- B. Directions: For each of the following, calculate the mean, median and mode. Show your solution. (Ungrouped data) 1. 7, 8, 9, 5, 8, 7, 7, 9, 8, 6 2. 100, 120, 132, 122, 145, 121, 105, 109, 3. 115, 119, 114, 112, 112, 109, 104, 106arrow_forwardFind the (a) mean, (b) median, (c) mode, and (d) midrange for the data and then (e) answer the given question. Listed below are the jersey numbers of 11 players randomly selected from the roster of a championship sports team. What do the results tell us? 61 51 5 73 85 37 41 6 59 82 18 a. Find the mean. b. Find the median. c. Find the mode. d. Find the midrange. e. What do the results tell us?arrow_forwardFind the median for the following group of data items. 35, 32, 31, 30, 36, 33, 29, 31 The median is 31.5 (Type an integer or a decimal.) Carrow_forward
arrow_back_ios
SEE MORE QUESTIONS
arrow_forward_ios
Recommended textbooks for you
- MATLAB: An Introduction with ApplicationsStatisticsISBN:9781119256830Author:Amos GilatPublisher:John Wiley & Sons Inc
 Probability and Statistics for Engineering and th...StatisticsISBN:9781305251809Author:Jay L. DevorePublisher:Cengage Learning
 Statistics for The Behavioral Sciences (MindTap C...StatisticsISBN:9781305504912Author:Frederick J Gravetter, Larry B. WallnauPublisher:Cengage Learning
  Elementary Statistics: Picturing the World (7th E...StatisticsISBN:9780134683416Author:Ron Larson, Betsy FarberPublisher:PEARSON
 The Basic Practice of StatisticsStatisticsISBN:9781319042578Author:David S. Moore, William I. Notz, Michael A. FlignerPublisher:W. H. Freeman
 Introduction to the Practice of StatisticsStatisticsISBN:9781319013387Author:David S. Moore, George P. McCabe, Bruce A. CraigPublisher:W. H. Freeman
MATLAB: An Introduction with Applications
Statistics
ISBN:9781119256830
Author:Amos Gilat
Publisher:John Wiley & Sons Inc
Probability and Statistics for Engineering and th...
Statistics
ISBN:9781305251809
Author:Jay L. Devore
Publisher:Cengage Learning
Statistics for The Behavioral Sciences (MindTap C...
Statistics
ISBN:9781305504912
Author:Frederick J Gravetter, Larry B. Wallnau
Publisher:Cengage Learning
Elementary Statistics: Picturing the World (7th E...
Statistics
ISBN:9780134683416
Author:Ron Larson, Betsy Farber
Publisher:PEARSON
The Basic Practice of Statistics
Statistics
ISBN:9781319042578
Author:David S. Moore, William I. Notz, Michael A. Fligner
Publisher:W. H. Freeman
Introduction to the Practice of Statistics
Statistics
ISBN:9781319013387
Author:David S. Moore, George P. McCabe, Bruce A. Craig
Publisher:W. H. Freeman