
MATLAB: An Introduction with Applications
6th Edition
ISBN: 9781119256830
Author: Amos Gilat
Publisher: John Wiley & Sons Inc
expand_more
expand_more
format_list_bulleted
Related questions
Question
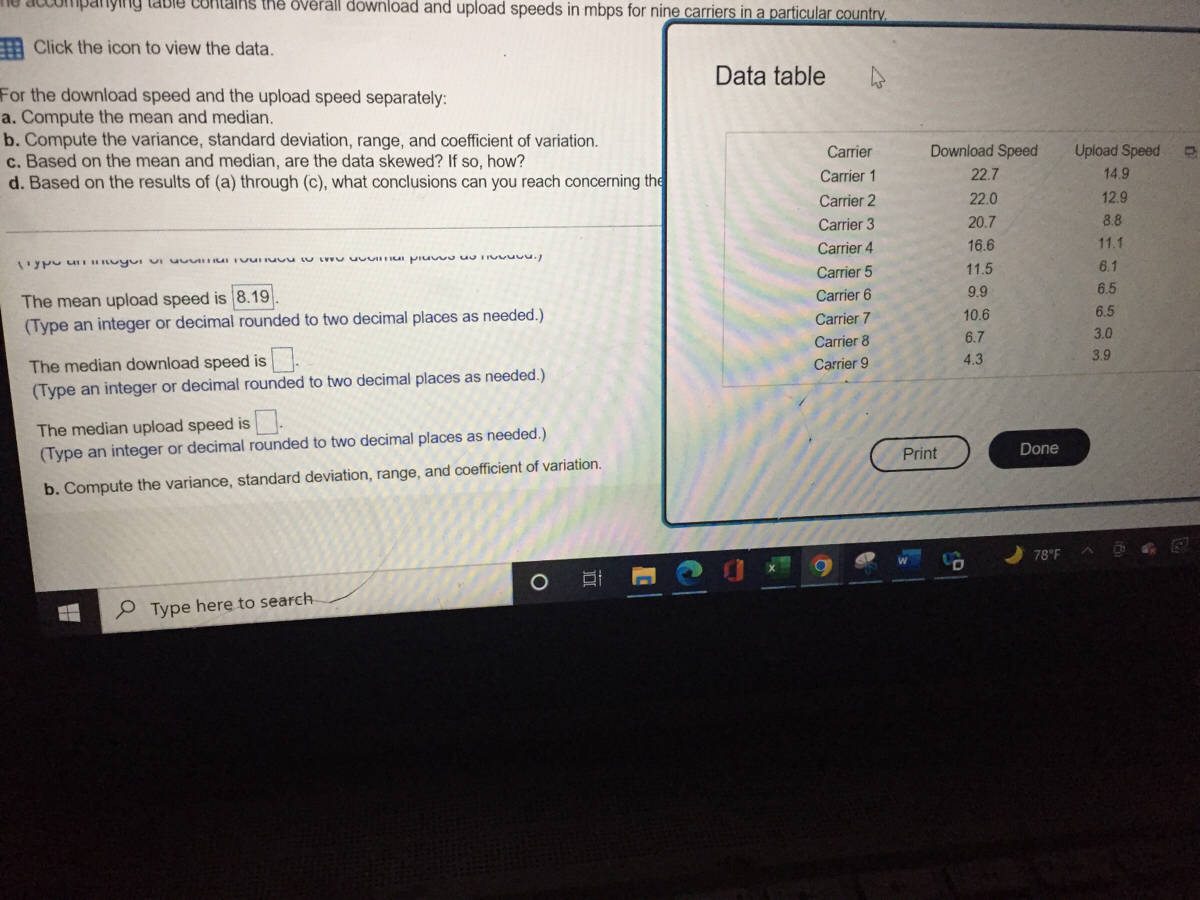

Transcribed Image Text:ying lable Conlains the ovérall download and upload speeds in mbps for nine carriers in a particular country
A Click the icon to view the data.
Data table
For the download speed and the upload speed separately:
a. Compute the mean and median.
b. Compute the variance, standard deviation, range, and coefficient of variation.
c. Based on the mean and median, are the data skewed? If so, how?
d. Based on the results of (a) through (c), what conclusions can you reach concerning the
Carrier
Download Speed
Upload Speed
Carrier 1
22.7
14.9
Carrier 2
22.0
12.9
Carrier 3
20.7
8.8
Carrier 4
16.6
11.1
Carrier 5
11.5
6.1
9.9
6.5
The mean upload speed is 8.19
(Type an integer or decimal rounded to two decimal places as needed.)
Carrier 6
Carrier 7
10.6
6.5
6.7
3.0
Carrier 8
3.9
The median download speed is
(Type an integer or decimal rounded to two decimal places as needed.)
Carrier 9
4.3
The median upload speed is .
(Type an integer or decimal rounded to two decimal places as needed.)
Print
Done
b. Compute the variance, standard deviation, range, and coefficient of variation.
78 F
P Type here to search
Expert Solution
This question has been solved!
Explore an expertly crafted, step-by-step solution for a thorough understanding of key concepts.

Step by stepSolved in 6 steps with 6 images

Knowledge Booster

Similar questions
- What type of data (categorical, discrete numerical, continuous numerical) is each of the following variables? If there is any ambiguity about the data type, explain why the answer is unclear. Your college program. The number of college credits you have earned. Length of a TV commercial. The country with the most 2021 Olympic medalsarrow_forwardcalculate mean, median, standard deviation, range , IQR, and coefficient of variation for the following data 5,2,7,8,12,11,9,4,5,10arrow_forwardThe following refer to the following data set: 20 28 44 92 64 48 68 43 86 43 What is the mean (7) of this data set? mean = (Please show your answer to one decimal place.) What is the median of this data set? median = %3D What is the mode of this data set? mode = %3Darrow_forward
- Using PivotTables, find the mean and standard deviation of sales by region in the data provided. LOADING... Click the icon to view the data. Question content area bottom Part 1 Complete the table below. (Type integers or decimals rounded to two decimal places as needed.) Average of Amount StdDev of Amount East enter your response here enter your response here North enter your response here enter your response here South enter your response here enter your response here West enter your response here enter your response here Grand Total enter your response here enter your response herearrow_forwardUse the stem-and-leaf plot to list the actual data entries. What is the maximum data entry? What is the minimum data entry? Key: 2 | 7=27 27 3 2 4 1224779 5 011233 3 4 4 4 4 56 689 6 999 7 399 8 5 Choose the correct actual data entries below. O A. 27, 32, 41, 42, 42, 44, 47, 47, 49, 50, 51, 51, 52, 53, 53, 53, 54, 54, 54, 54, 55, 56, 56, 58, 59, 69, 69, 69, 73, 79, 79, 85 B. 27, 32, 41, 42, 44, 47, 49, 50, 51, 52, 53, 54, 55, 56, 58, 59, 69, 73, 79, 85 OC. 2.7, 3.2, 4.1, 4.2, 4.4, 4.7, 4.9, 5.0, 5.1, 5.2, 5.3, 5.4, 5.5, 5.6, 5.8, 5.9,6.9, 7.3, 7.9, 8.5 O D. 2.7, 3.2, 4.1, 4.2, 4.2, 4.4, 4.7, 4.7, 4.9, 5.0, 5.1, 5.1, 5.2, 5.3, 5.3, 5.3, 5.4, 5.4, 5.4, 5.4, 5.5, 5.6, 5.6, 5.8, 5.9, 6.9, 6.9, 6.9, 7.3, 7.9, 7.9, 8.5 The maximum data entry is The minimum data entry isarrow_forwardwrite proparrow_forward
- Refer back to the histogram from question #4. Compute the mean number of shipping days Compute the median number of shipping days Write the 5-number summary for this data. Create box plot.arrow_forwardwebsite monitors customer complaints and organizes these complaints into six distinct categories. Overthe past year, the company has received 534 complaints One possible graphical method for representing these data is a scatter plot. A. TRUE B. FALSEarrow_forwardHere is a FDT for a small data set: data freq 25 3 26 4 27 2 28 4 29 7 Find the following measures of central tendency.mean = median = mode =arrow_forward
arrow_back_ios
arrow_forward_ios
Recommended textbooks for you
- MATLAB: An Introduction with ApplicationsStatisticsISBN:9781119256830Author:Amos GilatPublisher:John Wiley & Sons Inc
 Probability and Statistics for Engineering and th...StatisticsISBN:9781305251809Author:Jay L. DevorePublisher:Cengage Learning
 Statistics for The Behavioral Sciences (MindTap C...StatisticsISBN:9781305504912Author:Frederick J Gravetter, Larry B. WallnauPublisher:Cengage Learning
  Elementary Statistics: Picturing the World (7th E...StatisticsISBN:9780134683416Author:Ron Larson, Betsy FarberPublisher:PEARSON
 The Basic Practice of StatisticsStatisticsISBN:9781319042578Author:David S. Moore, William I. Notz, Michael A. FlignerPublisher:W. H. Freeman
 Introduction to the Practice of StatisticsStatisticsISBN:9781319013387Author:David S. Moore, George P. McCabe, Bruce A. CraigPublisher:W. H. Freeman
MATLAB: An Introduction with Applications
Statistics
ISBN:9781119256830
Author:Amos Gilat
Publisher:John Wiley & Sons Inc
Probability and Statistics for Engineering and th...
Statistics
ISBN:9781305251809
Author:Jay L. Devore
Publisher:Cengage Learning
Statistics for The Behavioral Sciences (MindTap C...
Statistics
ISBN:9781305504912
Author:Frederick J Gravetter, Larry B. Wallnau
Publisher:Cengage Learning
Elementary Statistics: Picturing the World (7th E...
Statistics
ISBN:9780134683416
Author:Ron Larson, Betsy Farber
Publisher:PEARSON
The Basic Practice of Statistics
Statistics
ISBN:9781319042578
Author:David S. Moore, William I. Notz, Michael A. Fligner
Publisher:W. H. Freeman
Introduction to the Practice of Statistics
Statistics
ISBN:9781319013387
Author:David S. Moore, George P. McCabe, Bruce A. Craig
Publisher:W. H. Freeman