
Essentials Of Investments
11th Edition
ISBN: 9781260013924
Author: Bodie, Zvi, Kane, Alex, MARCUS, Alan J.
Publisher: Mcgraw-hill Education,
expand_more
expand_more
format_list_bulleted
Related questions
Concept explainers
Question
The following graph represents the Cumulative Average Abnormal Return (CAAR) for the stocks of companies targeted for take-over.
Which of the following statements is true?
| a. |
In a weak form |
|
| b. |
In a semi-strong form efficient market, t* is the takeover announcement event |
|
| c. |
In a strong form efficient market, t* is the acquiring company takeover decision event (i.e. the time when an acquiring company decides to launch a takeover) |
|
| d. |
(a) & (b) |
|
| e. |
(b) & (c) |
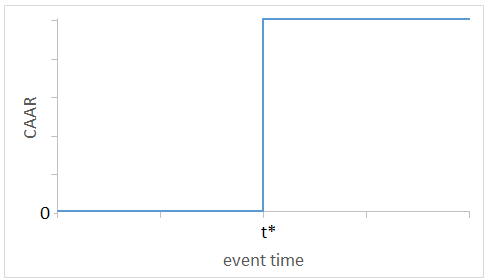

Transcribed Image Text:CAAR
0
t*
event time
Expert Solution
This question has been solved!
Explore an expertly crafted, step-by-step solution for a thorough understanding of key concepts.

Step by stepSolved in 4 steps

Knowledge Booster


Learn more about
Need a deep-dive on the concept behind this application? Look no further. Learn more about this topic, finance and related others by exploring similar questions and additional content below.Similar questions
- Which of the following characteristics accurately describes the stock market? An active market that determines the price of a firm’s shares A fixed-income market where participants buy and sell debt securities The bid-ask spread in a dealer market represents the profit that a dealer would make on a transaction involving a security. Which of the following statements best describes the bid-ask spread? The difference between the closing price of the security and the opening price of the security on the day of the transaction. The sum of the price at which a dealer is willing to buy a security and the price at which a dealer is willing to sell it. The difference between the price at which a dealer is willing to buy a security and the price at which a dealer is willing to sell it. Fernando, a trader, wants to buy 1,000 shares of XYZ stock, while a second trader, Ally, is willing to sell 1,500 shares of the same stock. Unfortunately, Fernando…arrow_forwardConsider each of the following statements, state whether you believe they are true orfalse and explain your choice of answer (I) The dividend valuation model can only be used for determining the shareprice if a company is currently paying dividends and those dividends areexpected to grow at a constant rate.(ii) The fact that share prices may be highly volatile does not necessarily meanthat the stock market is inefficient.(iii) Newly listed companies are much more difficult to value using the dividendvaluation model than are companies with a long history of being listed on the stock exchange.(iv) The dividend valuation model only takes account of financial payments to shareholders and as such does not take account of intangible factors such as brand loyalty, goodwill and patents) which are likely to impact on share value.arrow_forwardIn a targeted stock repurchase, ... O A. ... a firm uses a tender offer to buy back a large number of own shares. O B. ... a firm buys back own stock from shareholders on the open market. O C. ... a firm distributes put options on its own shares to its shareholders. O D.... a firm buys back own shares from one or few major shareholders.arrow_forward
- The residual dividend approach is the best dividend policy to adopt if a firm’s management wants to maximize the current value per share of the existing stock. Do you agree or disagree with this statement? State and justify your conclusions.arrow_forwardWhich of the following is correct a. In a leveraged recapitalization, a firm uses its excess cash to buyback shares b. In an LBO, a firm borrows and repurchases its shares thereby reducng the number of shares outstanding. c. In a leveraged recapitalization, a change of ownership occurs as the firm is sold d. In an LBO, debt is a major component of the financing and a change of control occurs. e. In an LBO, managers use excess cash to repurchase sharesarrow_forwardTrue or False: The following statement accurately describes how firms make decisions related to issuing new common stock. Taking flotation costs into account will reduce the cost of new common stock. O False: Flotation costs are additional costs associated with raising new common stock. O True: Taking flotation costs into account will reduce the cost of new common stock, because you will multiply the cost of new common stock by 1 minus the flotation cost-similar to how the after-tax cost of debt is calculated. Alpha Moose Transporters is considering investing in a one-year project that requires an initial investment of $475,000. To do so, it will have to issue new common stock and will incur a flotation cost of 2.00%. At the end of the year, the project is expected to produce a cash inflow of $595,000. The rate of return that Alpha Moose expects to earn on its project (net of its flotation costs) is (rounded to two decimal places). Sunny Day Manufacturing Company has a current stock…arrow_forward
- Which one of the following statements about dividend policies is FALSE? a. One advantage of dividend reinvestment plans is that they allow shareholders to maintain a position in a company with minimal trading. b. One key disadvantage of a residual dividend policy is that it makes it hard for a company to follow a stable dividend policy. c. The clientele effect suggests that brokerage companies should choose customers whose dividend preferences match those of their client service borkers. d. The "bird-in-the-hand effect" is the argument that investors prefer dividends to capital gains because dividends are more certain than capital gains. e. In today's tax environment, gains through stock repurchases and dividend payments are taxed at the same ratearrow_forwardIf the intrinsic value of a stock is below the current market price, over time we can expect buy orders to exceed sell orders, causing the price to rise buy and sell orders to be evenly matched, keeping the price at its current level sell orders to exceed buy orders, causing the price to rise sell orders to exceed buy orders, causing the price to fall buy orders to exceed sell orders, causing the price to fallarrow_forwardThe most common methods for repurchasing shares is structural programs, such as accelerated share repurchase (ASR) programs Question options: a) True b) Falsearrow_forward
- Answer in typingarrow_forwardReverse engineering share prices is an exercise in deductive reasoning. If we assume market price reflects share value, then through reverse engineering we can infer what the market assumes about a. the expected rate of return on equity capital, holding expected profitability and long-run growth constant. b. the expected profitability, holding the expected rate of return on equity capital and long-run growth constant. c. the expected long-run growth, holding the expected rate of return on equity capital and expected profitability constant.arrow_forwardWhich of the following is a reason why an investor would place a stop buy order on a stock? To ensure a short position is closed out for profit To ensure that the broker executes immediately at the current market price To ensure the stock is sold before its price falls to a specified level To ensure the stock is purchased when its price is risingarrow_forward
arrow_back_ios
SEE MORE QUESTIONS
arrow_forward_ios
Recommended textbooks for you
- Essentials Of InvestmentsFinanceISBN:9781260013924Author:Bodie, Zvi, Kane, Alex, MARCUS, Alan J.Publisher:Mcgraw-hill Education,


 Foundations Of FinanceFinanceISBN:9780134897264Author:KEOWN, Arthur J., Martin, John D., PETTY, J. WilliamPublisher:Pearson,
 Fundamentals of Financial Management (MindTap Cou...FinanceISBN:9781337395250Author:Eugene F. Brigham, Joel F. HoustonPublisher:Cengage Learning
 Corporate Finance (The Mcgraw-hill/Irwin Series i...FinanceISBN:9780077861759Author:Stephen A. Ross Franco Modigliani Professor of Financial Economics Professor, Randolph W Westerfield Robert R. Dockson Deans Chair in Bus. Admin., Jeffrey Jaffe, Bradford D Jordan ProfessorPublisher:McGraw-Hill Education
Essentials Of Investments
Finance
ISBN:9781260013924
Author:Bodie, Zvi, Kane, Alex, MARCUS, Alan J.
Publisher:Mcgraw-hill Education,
Foundations Of Finance
Finance
ISBN:9780134897264
Author:KEOWN, Arthur J., Martin, John D., PETTY, J. William
Publisher:Pearson,
Fundamentals of Financial Management (MindTap Cou...
Finance
ISBN:9781337395250
Author:Eugene F. Brigham, Joel F. Houston
Publisher:Cengage Learning
Corporate Finance (The Mcgraw-hill/Irwin Series i...
Finance
ISBN:9780077861759
Author:Stephen A. Ross Franco Modigliani Professor of Financial Economics Professor, Randolph W Westerfield Robert R. Dockson Deans Chair in Bus. Admin., Jeffrey Jaffe, Bradford D Jordan Professor
Publisher:McGraw-Hill Education