
Essentials Of Investments
11th Edition
ISBN: 9781260013924
Author: Bodie, Zvi, Kane, Alex, MARCUS, Alan J.
Publisher: Mcgraw-hill Education,
expand_more
expand_more
format_list_bulleted
Related questions
Concept explainers
Topic Video
Question

Transcribed Image Text:es
Current assets
Cash
Accounts receivable
Inventory
Total
Assets
Sales
Cost of goods sold
Depreciation
Fixed assets
Net plant and equipment $49,749 $74,097
Total assets
$70,215
$97,107
EBIT
Interest paid
Taxable income
Taxes
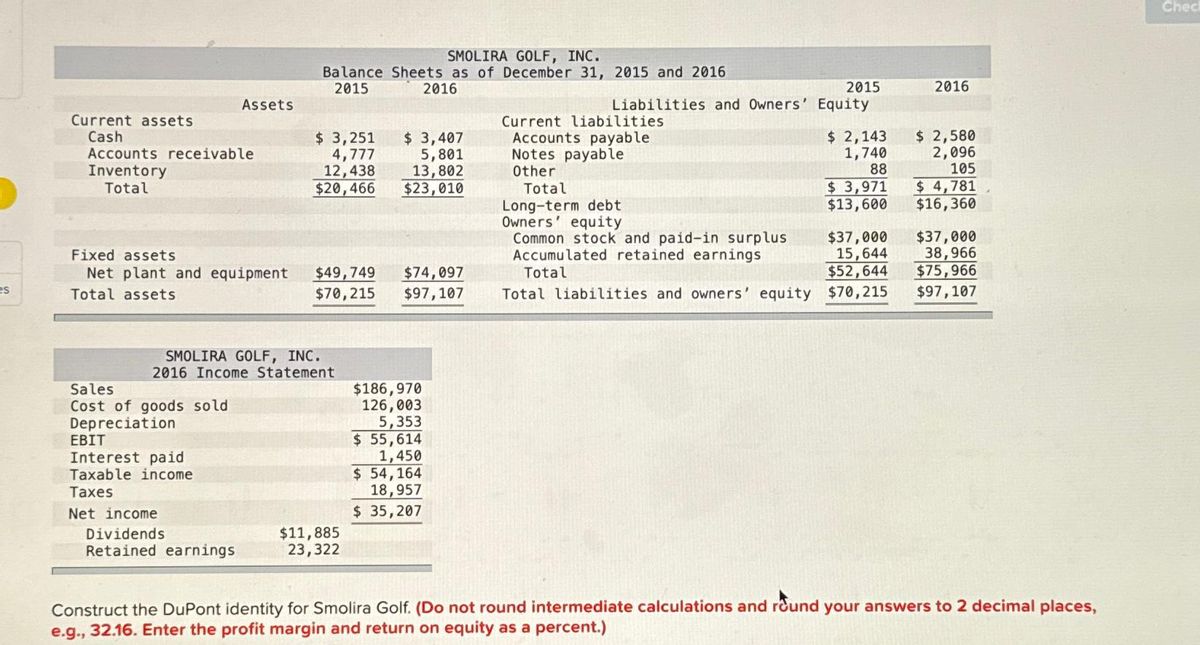
SMOLIRA GOLF, INC.
Balance Sheets as of December 31, 2015 and 2016
2015
2016
SMOLIRA GOLF, INC.
2016 Income Statement
Net income
Dividends
Retained earnings
$3,251
4,777
$ 3,407
5,801
13,802
12,438
$20,466 $23,010
$11,885
23,322
$186,970
126,003
5,353
$ 55,614
1,450
$ 54,164
18,957
$ 35,207
2015
Liabilities and Owners' Equity
Current liabilities
Accounts payable
Notes payable
Other
Total
Long-term debt
Owners' equity
Common stock and paid-in surplus
Accumulated retained earnings
Total
2016
$ 2,143 $ 2,580
1,740 2,096
88
105
$3,971 $4,781
$13,600 $16,360
$37,000
15,644
$37,000
38,966
$52,644 $75,966
Total liabilities and owners' equity $70,215 $97,107
Construct the DuPont identity for Smolira Golf. (Do not round intermediate calculations and round your answers to 2 decimal places,
e.g., 32.16. Enter the profit margin and return on equity as a percent.)
Check
Expert Solution
This question has been solved!
Explore an expertly crafted, step-by-step solution for a thorough understanding of key concepts.

Step by stepSolved in 3 steps with 4 images

Knowledge Booster


Learn more about
Need a deep-dive on the concept behind this application? Look no further. Learn more about this topic, finance and related others by exploring similar questions and additional content below.Similar questions
- Give me right answerarrow_forwardRequired information [The following information applies to the questions displayed below.] Simon Company’s year-end balance sheets follow. At December 31 2017 2016 2015 Assets Cash $ 31,800 $ 35,625 $ 37,800 Accounts receivable, net 89,500 62,500 50,200 Merchandise inventory 112,500 82,500 54,000 Prepaid expenses 10,700 9,375 5,000 Plant assets, net 278,500 255,000 230,500 Total assets $ 523,000 $ 445,000 $ 377,500 Liabilities and Equity Accounts payable $ 129,900 $ 75,250 $ 51,250 Long-term notes payable secured bymortgages on plant assets 98,500 101,500 83,500 Common stock, $10 par value 163,500 163,500 163,500 Retained earnings 131,100 104,750 79,250 Total liabilities and equity $ 523,000 $ 445,000 $ 377,500 The company’s income statements for the years ended December 31, 2017 and 2016, follow. Assume…arrow_forwardPartial balance sheets and additional information are listed below for Monaco Company. Monaco Company Partial Balance Sheets as of December 31 2018 2017 Assets Cash $ 30,000 $ 15,000 Accounts receivable 50,000 80,000 Inventory 20,000 30,000 Liabilities Accounts payable $ 55,000 $ 62,000 Additional information for 2018: Net income was $260,000.Depreciation expense was $20,000.Sales totaled $700,000.Cost of goods sold totaled $295,000. Required:Prepare the summary entry for the amount of cash paid to merchandise suppliers during 2018. (If no entry is required for a transaction/event, select "No journal entry required" in the first account field.)arrow_forward
- equired information [The following information applies to the questions displayed below.] Simon Company’s year-end balance sheets follow. At December 31 2017 2016 2015 Assets Cash $ 31,800 $ 35,625 $ 37,800 Accounts receivable, net 89,500 62,500 50,200 Merchandise inventory 112,500 82,500 54,000 Prepaid expenses 10,700 9,375 5,000 Plant assets, net 278,500 255,000 230,500 Total assets $ 523,000 $ 445,000 $ 377,500 Liabilities and Equity Accounts payable $ 129,900 $ 75,250 $ 51,250 Long-term notes payable secured bymortgages on plant assets 98,500 101,500 83,500 Common stock, $10 par value 163,500 163,500 163,500 Retained earnings 131,100 104,750 79,250 Total liabilities and equity $ 523,000 $ 445,000 $ 377,500 The company’s income statements for the years ended December 31, 2017 and 2016, follow.…arrow_forwardUse the following excerpts from Victrolia Company’s financial information. 2018 Income Statment Balance Sheets Sales $475,000 Cost of Goods Sold (221,500) Operating Expenses, other thanDepreciation Expense (60,600) Depreciation Expense (21,000) Gain on Sale of Plant Assets 23,500 Net Income $195,400 Dec. 31,2018 Cash $347,450 Accounts Receivable 39,750 Inventory 33,000 Accounts Payable 17,550 Accured Liabilities 3,500 Dec. 31, 2017 Cash $133,500 Accounts Receivable 36,500 Inventory 35,000 Accounts Payable 19,550 Accured Liabilities 2,200 Additional Information: Plant assets were sold for $45,000; book value $16,500 Dividends of $22,000 were declared and paid Cash Flow from Financing Activities: $Dividends Paid I just need the answer on dividends answer box?arrow_forwardComputing rate of return on total assets Barot’s 2018 financial statements reported the following items—with 2017 figures given for comparison: Net income for 2018 was $3,910, and interest expense was $240. Compute Barot’s rate of return on total assets for 2018. (Round to the nearest percent.)arrow_forward
- Use the following information to answer this question. Bayside, Inc.2017 Income Statement($ in thousands) Net sales $ 6,040 Cost of goods sold 4,200 Depreciation 400 Earnings before interest and taxes $ 1,440 Interest paid 30 Taxable income $ 1,410 Taxes 423 Net income $ 987 Bayside, Inc.2016 and 2017 Balance Sheets($ in thousands) 2016 2017 2016 2017 Cash $ 115 $ 220 Accounts payable $ 1,580 $ 1,510 Accounts rec. 990 830 Long-term debt 810 610 Inventory 1,705 2,040 Common stock 3,240 3,280 Total $ 2,810 $ 3,090 Retained earnings 880 1,130 Net fixed assets 3,700 3,440 Total assets $ 6,510 $ 6,530 Total liab. & equity $ 6,510 $ 6,530 What is the return on equity for 2017?arrow_forwardFind the price at which Aastha will get a margin call, and the price at which Brian will get a margin call.arrow_forwardUse the following information to answer this question. Windswept, Inc.2017 Income Statement($ in millions) Net sales $ 9,390 Cost of goods sold 7,660 Depreciation 455 Earnings before interest and taxes $ 1,275 Interest paid 100 Taxable income $ 1,175 Taxes 411 Net income $ 764 Windswept, Inc.2016 and 2017 Balance Sheets($ in millions) 2016 2017 2016 2017 Cash $ 210 $ 240 Accounts payable $ 1,290 $ 1,335 Accounts rec. 960 860 Long-term debt 1,080 1,280 Inventory 1,750 1,665 Common stock 3,300 3,190 Total $ 2,920 $ 2,765 Retained earnings 620 870 Net fixed assets 3,370 3,910 Total assets $ 6,290 $ 6,675 Total liab. & equity $ 6,290 $ 6,675 What is the quick ratio for 2017?arrow_forward
- One Stop, Inc. Comparative Balance Sheet December 31, 2018 and 2017 2018 2017 Assets Current Assets: Cash $26,800 $14,900 Accounts Receivable 26,700 25,500 Merchandise Inventory 79,900 91,900 Long-term Assets: Land 35,400 8,000 Plant Assets 117,550 109,150 Accumulated Depreciation—Plant Assets (19,650) (15,450) Total Assets $266,700 $234,000 Liabilities Current Liabilities: Accounts Payable $35,000 $30,700 Accrued Liabilities 28,600 30,200 Long-term Liabilities: Notes Payable 73,000 105,000 Total Liabilities 136,600 165,900 Stockholders' Equity Common Stock, no par 88,200 64,300 Retained Earnings 41,900 3,800 Total Stockholders' Equity 130,100 68,100 Total Liabilities and Stockholders' Equity $266,700 $234,000 One Stop, Inc. Income Statement Year Ended December 31,…arrow_forwardS18-3 Vertical analysis Tri-State Optical Company Ltd reported the following amounts on its balance sheet at 31 December 2016 and 2015: 2016 2015 Cash and receivables $ 54 530 $ 46 860 32 670 Inventory Property, plant and equipment, net 42 435 108 035 85 470 Total assets $205 000 $165 000 Requirement Prepare a vertical analysis of Tri-State's assets for 2016 and 2015.arrow_forwardequired information [The following information applies to the questions displayed below.] Simon Company’s year-end balance sheets follow. At December 31 2017 2016 2015 Assets Cash $ 31,800 $ 35,625 $ 37,800 Accounts receivable, net 89,500 62,500 50,200 Merchandise inventory 112,500 82,500 54,000 Prepaid expenses 10,700 9,375 5,000 Plant assets, net 278,500 255,000 230,500 Total assets $ 523,000 $ 445,000 $ 377,500 Liabilities and Equity Accounts payable $ 129,900 $ 75,250 $ 51,250 Long-term notes payable secured bymortgages on plant assets 98,500 101,500 83,500 Common stock, $10 par value 163,500 163,500 163,500 Retained earnings 131,100 104,750 79,250 Total liabilities and equity $ 523,000 $ 445,000 $ 377,500 The company’s income statements for the years ended December 31, 2017 and 2016, follow.…arrow_forward
arrow_back_ios
SEE MORE QUESTIONS
arrow_forward_ios
Recommended textbooks for you
- Essentials Of InvestmentsFinanceISBN:9781260013924Author:Bodie, Zvi, Kane, Alex, MARCUS, Alan J.Publisher:Mcgraw-hill Education,


 Foundations Of FinanceFinanceISBN:9780134897264Author:KEOWN, Arthur J., Martin, John D., PETTY, J. WilliamPublisher:Pearson,
 Fundamentals of Financial Management (MindTap Cou...FinanceISBN:9781337395250Author:Eugene F. Brigham, Joel F. HoustonPublisher:Cengage Learning
 Corporate Finance (The Mcgraw-hill/Irwin Series i...FinanceISBN:9780077861759Author:Stephen A. Ross Franco Modigliani Professor of Financial Economics Professor, Randolph W Westerfield Robert R. Dockson Deans Chair in Bus. Admin., Jeffrey Jaffe, Bradford D Jordan ProfessorPublisher:McGraw-Hill Education
Essentials Of Investments
Finance
ISBN:9781260013924
Author:Bodie, Zvi, Kane, Alex, MARCUS, Alan J.
Publisher:Mcgraw-hill Education,
Foundations Of Finance
Finance
ISBN:9780134897264
Author:KEOWN, Arthur J., Martin, John D., PETTY, J. William
Publisher:Pearson,
Fundamentals of Financial Management (MindTap Cou...
Finance
ISBN:9781337395250
Author:Eugene F. Brigham, Joel F. Houston
Publisher:Cengage Learning
Corporate Finance (The Mcgraw-hill/Irwin Series i...
Finance
ISBN:9780077861759
Author:Stephen A. Ross Franco Modigliani Professor of Financial Economics Professor, Randolph W Westerfield Robert R. Dockson Deans Chair in Bus. Admin., Jeffrey Jaffe, Bradford D Jordan Professor
Publisher:McGraw-Hill Education