MATLAB: An Introduction with Applications
6th Edition
ISBN: 9781119256830
Author: Amos Gilat
Publisher: John Wiley & Sons Inc
expand_more
expand_more
format_list_bulleted
Question
thumb_up100%

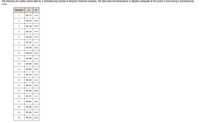
Transcribed Image Text:The following are quality control data for a manufacturing process at Kensport Chemical Company. The data show the temperature in degrees centigrade at five points in time during a manufacturing
cycle.
Sample
R
1
95.72
1.0
2
95.24
0.9
3
95.18
0.9
4
95.42
0.4
5
95.46
0.5
6.
95.32
1.1
7
95.40
0.9
8
95.44
0.3
9.
95.08
0.2
10
95.50
0.6
11
95.80
0.6
12
95.22
0.2
13
95.54
1.3
14
95.22
0.4
15
95.04
0.8
16
95.72
1.1
17
94.82
0.6
18
95.46
0.5
19
95.60
0.4
20
95.74
0.6

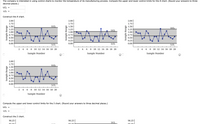
Transcribed Image Text:The company is interested in using control charts to monitor the temperature of its manufacturing process. Compute the upper and lower control limits for the R chart. (Round your answers to three
decimal places.)
UCL =
LCL =
Construct the R chart.
2.00-
2.00-
2.00
1.75
1.75
1.75
1.50
UCL
1.50
1.50
UCL
1.25
1.25
1.25
UCL
1.00-
1.00
1.00
0.75
0.75
0.75
0.50
0.50
0.50
0.25
0.25
0.25
0.00
0.00
LCL
0.00
LCL
LCL
2 4 6 8 10 12 14 16 18 20
4
6 8 10 12 14 16 18 20
2 4 6 8 10 12 14 16 18 20
Sample Number
Sample Number
Sample Number
2.00-
1.75
UCL
1.50
1.25
1.00
0.75
0.50
0.25
0.00
LCL
2 4 6 8 10 12 14 16 18 20
Sample Number
Compute the upper and lower control limits for the x chart. (Round your answers to three decimal places.)
UCL =
LCL =
Construct the x chart.
96.25
96.25
96.25
UCL
96.00-
96.00
96.00
Sample Range
Sample Range
Sample Range
Sample Range
Expert Solution
This question has been solved!
Explore an expertly crafted, step-by-step solution for a thorough understanding of key concepts.
Step by stepSolved in 5 steps with 2 images

Knowledge Booster
Learn more about
Need a deep-dive on the concept behind this application? Look no further. Learn more about this topic, statistics and related others by exploring similar questions and additional content below.Similar questions
- Typed asap Please give me quality solution And as soon as possible thanksarrow_forwardPrehistoric pottery vessels are usually found as sherds (broken pieces) and are carefully reconstructed if enough sherds can be found. An archaeological study provides data relating x = body diameter in centimeters and y = height in centimeters of prehistoric vessels reconstructed from sherds found at a prehistoric site. The following Minitab printout provides an analysis of the data. SE Coef Predictor Coef T P Constant -0.242 2.429 -0.09 0.929 Diameter 0.7905 0.1471 5.57 0.001 S = 4.07980 R-Sq = 86.1% (a) Minitab calls the explanatory variable the predictor variable. Which is the predictor variable, the diameter of the pot or the height? O diameter O height (b) For the least-squares line ý = a + bx, what is the value of the constant a? What is the value of the slope b? (Note: The slope is the coefficient of the predictor variable.) Write the equation of the least-squares line. a = -0.242 b =0.7905 ý = -0.242 +0.7905 (c) The P-value for a two-tailed test corresponding to each…arrow_forwardDetermine whether the given value is a statistic or a parameter. A homeowner measured the voltage supplied to his home on 23 days of a given month, and the average (mean) value is 143.1 volts. Part 1 Choose the correct answer below. A. The given value is a statistic for the month because the data collected represent a population. B. The given value is a parameter for the month because the data collected represent a sample. C. The given value is a parameter for the month because the data collected represent a population. D. The given value is a statistic for the month because the data collected represent a sample.arrow_forward
- Please help with (f). The two fill in questions. Thank you.arrow_forwardiv, v only please. thank youarrow_forwardCan a low barometer reading be used to predict maximum wind speed of an approaching tropical cydone? For a random sample of tropical cyclones, let x be the lowest pressure (in millibars) as a cyclone approaches, and let y be the maximum wind speed (in miles per hour) of the cyclone. x 1004 975 992 935 971 924 y 40 100 65 145 78 147 A USE SALT (a) Make a scatter diagram ofr the data and visualize the line you think best fits the data. * 140 1000 140 1000 120- 120 100 100 80 80 940 60 940 E 60 40 40e. 920li 40 920 40 60 80 100 120 140 940 960 980 1000 60 80 100 120 140 940 960 980 1000 x (lowest pressure (in millibars) x (lowest pressure (in millibars) x (lowest pressure (in millibars)) x (lowest pressure (in millibars) (b) Would you say the correlation is low, moderate, or strong? O low O moderate O strong Would you say the correlation is positive or negative? O positive O negative (C) Use a calculator to verity thatx - 5801, - 5,613,547, E- 575, E- 64,543 and xy - 549,281. Compute r.…arrow_forward
- please show all steps for this practice questionarrow_forwardplease provide correct answers and a good format table.I will also attach some pictures how the table should be.arrow_forwardQ19 determine whether the given value is a statistic or a parameter. A homeowner measured the voltage supplied to his home on all 7 days of a given week, and the average ( mean ) value is 126.3 volts. choose the correct answer below . A. The given value is a parameter for the week because the data collected respresent a population. b. The given value is a parameter for the week because the data collected represent a sample. c. The given value is a statistic for the week because the data collected represent a population. d. The given value is a statistic for the week because the data collected represent a sample.arrow_forward
arrow_back_ios
SEE MORE QUESTIONS
arrow_forward_ios
Recommended textbooks for you
 MATLAB: An Introduction with ApplicationsStatisticsISBN:9781119256830Author:Amos GilatPublisher:John Wiley & Sons Inc
 Probability and Statistics for Engineering and th...StatisticsISBN:9781305251809Author:Jay L. DevorePublisher:Cengage Learning
 Statistics for The Behavioral Sciences (MindTap C...StatisticsISBN:9781305504912Author:Frederick J Gravetter, Larry B. WallnauPublisher:Cengage Learning
 Elementary Statistics: Picturing the World (7th E...StatisticsISBN:9780134683416Author:Ron Larson, Betsy FarberPublisher:PEARSON
 The Basic Practice of StatisticsStatisticsISBN:9781319042578Author:David S. Moore, William I. Notz, Michael A. FlignerPublisher:W. H. Freeman
 Introduction to the Practice of StatisticsStatisticsISBN:9781319013387Author:David S. Moore, George P. McCabe, Bruce A. CraigPublisher:W. H. Freeman

MATLAB: An Introduction with Applications
Statistics
ISBN:9781119256830
Author:Amos Gilat
Publisher:John Wiley & Sons Inc

Probability and Statistics for Engineering and th...
Statistics
ISBN:9781305251809
Author:Jay L. Devore
Publisher:Cengage Learning

Statistics for The Behavioral Sciences (MindTap C...
Statistics
ISBN:9781305504912
Author:Frederick J Gravetter, Larry B. Wallnau
Publisher:Cengage Learning

Elementary Statistics: Picturing the World (7th E...
Statistics
ISBN:9780134683416
Author:Ron Larson, Betsy Farber
Publisher:PEARSON

The Basic Practice of Statistics
Statistics
ISBN:9781319042578
Author:David S. Moore, William I. Notz, Michael A. Fligner
Publisher:W. H. Freeman

Introduction to the Practice of Statistics
Statistics
ISBN:9781319013387
Author:David S. Moore, George P. McCabe, Bruce A. Craig
Publisher:W. H. Freeman