MATLAB: An Introduction with Applications
6th Edition
ISBN: 9781119256830
Author: Amos Gilat
Publisher: John Wiley & Sons Inc
expand_more
expand_more
format_list_bulleted
Question
Please help with (f). The two fill in questions. Thank you.

Transcribed Image Text:please
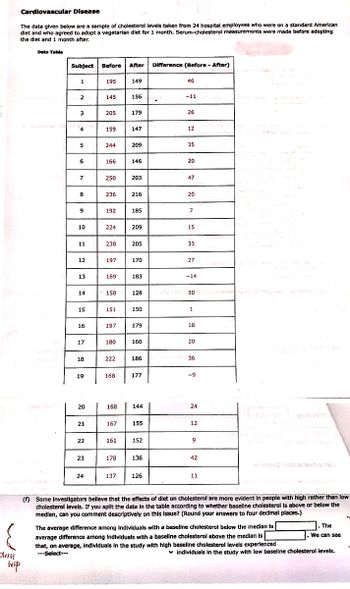
Cardiovascular Disease
The data given below are a sample of cholesterol levels taken from 24 hospital employees who were on a standard American
diet and who agreed to adopt a vegetarian diet for 1 month, Serum-cholesterol measurements were made before adopting
the diet and 1 month after.
Data Table
leip
Subject
1
2
3
4
5
6
7
·|-|-
8
9
10
11
12
13
14
15
16
17
18
19
20
21
22
23
24
Before After
195
145
|
205
159
244
166
250
236
192
224
238
197
169
158
151
197
180
222
168
168
167
161
178
137
149
156
179
147
209
146
203
216
185
209
205
170
183
128
150
179
160
186
177
144
155
152
136
126
Difference (Before - After)
46
-11
26
12
35
20
47
20
7
15
33
27
-14
30
1
18
20
36
-9
24
12
9
42
11
(f) Some Investigators believe that the effects of dlet on cholesterol are more evident in people with high rather than low
cholesterol levels. If you split the data in the table according to whether baseline cholesterol is above or below the
medlan, can you comment descriptively on this Issue? (Round your answers to four decimal places.)
The average difference among Individuals with a baseline cholesterol below the median Is
average difference among Individuals with a baseline cholesterol above the median Is
that, on average, individuals in the study with high baseline cholesterol levels experienced
---Select---
. The
We can see
✓ individuals in the study with low baseline cholesterol levels.
Expert Solution
This question has been solved!
Explore an expertly crafted, step-by-step solution for a thorough understanding of key concepts.
This is a popular solution
Trending nowThis is a popular solution!
Step by stepSolved in 2 steps with 4 images

Follow-up Questions
Read through expert solutions to related follow-up questions below.
Follow-up Question

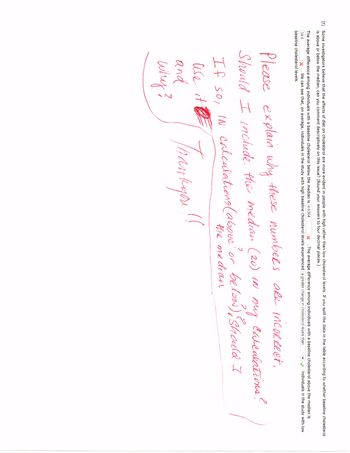
Transcribed Image Text:(f) Some Investigators believe that the effects of diet on cholesterol are more evident in people with high rather than low cholesterol levels. If you split the data in the table according to whether baseline cholesterol
is above or below the median, can you comment descriptively on this issue? (Round your answers to four decimal places.)
The average difference among individuals with a baseline cholesterol below the median is 4 6364
X. The average difference among individuals with a baseline cholesterol above the median is
346
X We can see that, on average, individuals in the study with high baseline cholesterol levels experienced a greater change in cholesterol levels than
baseline cholesterol levels.
individuals in the study with low
A
Please explain why these numbers are incorrect.
Should I include the median (20) IN
пиз
calculations?
If so, IN calculations (above" or below) Should I
the median
use it
and
wiry?
Thank you !!
Solution
by Bartleby Expert
Follow-up Questions
Read through expert solutions to related follow-up questions below.
Follow-up Question

Transcribed Image Text:(f) Some Investigators believe that the effects of diet on cholesterol are more evident in people with high rather than low cholesterol levels. If you split the data in the table according to whether baseline cholesterol
is above or below the median, can you comment descriptively on this issue? (Round your answers to four decimal places.)
The average difference among individuals with a baseline cholesterol below the median is 4 6364
X. The average difference among individuals with a baseline cholesterol above the median is
346
X We can see that, on average, individuals in the study with high baseline cholesterol levels experienced a greater change in cholesterol levels than
baseline cholesterol levels.
individuals in the study with low
A
Please explain why these numbers are incorrect.
Should I include the median (20) IN
пиз
calculations?
If so, IN calculations (above" or below) Should I
the median
use it
and
wiry?
Thank you !!
Solution
by Bartleby Expert
Knowledge Booster
Similar questions
- Hello, please answer all parts if possible. if not, please answer c, e and f, thank you.arrow_forwardFind the interquartile range. Interpret this value in context.arrow_forwardFill in the blank. A exists between two variables when the values of one variable are somehow associated with the values of the other variable. A exists between two variables when the values of one variable are somehow associated with the values of the other variable. Click to select your answer(s).arrow_forward
arrow_back_ios
arrow_forward_ios
Recommended textbooks for you
 MATLAB: An Introduction with ApplicationsStatisticsISBN:9781119256830Author:Amos GilatPublisher:John Wiley & Sons Inc
 Probability and Statistics for Engineering and th...StatisticsISBN:9781305251809Author:Jay L. DevorePublisher:Cengage Learning
 Statistics for The Behavioral Sciences (MindTap C...StatisticsISBN:9781305504912Author:Frederick J Gravetter, Larry B. WallnauPublisher:Cengage Learning
 Elementary Statistics: Picturing the World (7th E...StatisticsISBN:9780134683416Author:Ron Larson, Betsy FarberPublisher:PEARSON
 The Basic Practice of StatisticsStatisticsISBN:9781319042578Author:David S. Moore, William I. Notz, Michael A. FlignerPublisher:W. H. Freeman
 Introduction to the Practice of StatisticsStatisticsISBN:9781319013387Author:David S. Moore, George P. McCabe, Bruce A. CraigPublisher:W. H. Freeman

MATLAB: An Introduction with Applications
Statistics
ISBN:9781119256830
Author:Amos Gilat
Publisher:John Wiley & Sons Inc

Probability and Statistics for Engineering and th...
Statistics
ISBN:9781305251809
Author:Jay L. Devore
Publisher:Cengage Learning

Statistics for The Behavioral Sciences (MindTap C...
Statistics
ISBN:9781305504912
Author:Frederick J Gravetter, Larry B. Wallnau
Publisher:Cengage Learning

Elementary Statistics: Picturing the World (7th E...
Statistics
ISBN:9780134683416
Author:Ron Larson, Betsy Farber
Publisher:PEARSON

The Basic Practice of Statistics
Statistics
ISBN:9781319042578
Author:David S. Moore, William I. Notz, Michael A. Fligner
Publisher:W. H. Freeman

Introduction to the Practice of Statistics
Statistics
ISBN:9781319013387
Author:David S. Moore, George P. McCabe, Bruce A. Craig
Publisher:W. H. Freeman