Glencoe Algebra 1, Student Edition, 9780079039897, 0079039898, 2018
18th Edition
ISBN: 9780079039897
Author: Carter
Publisher: McGraw Hill
expand_more
expand_more
format_list_bulleted
Question

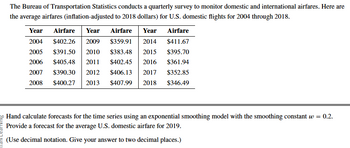
Transcribed Image Text:The Bureau of Transportation Statistics conducts a quarterly survey to monitor domestic and international airfares. Here are
the average airfares (inflation-adjusted to 2018 dollars) for U.S. domestic flights for 2004 through 2018.
Airfare Year Airfare Year
Year
2004 $402.26 2009 $359.91 2014
2005 $391.50 2010 $383.48 2015 $395.70
2006 $405.48 2011 $402.45 2016 $361.94
2007 $390.30 2012 $406.13 2017 $352.85
2008 $400.27 2013 $407.99 2018 $346.49
Airfare
$411.67
Hand calculate forecasts for the time series using an exponential smoothing model with the smoothing constant w = 0.2.
Provide a forecast for the average U.S. domestic airfare for 2019.
(Use decimal notation. Give your answer to two decimal places.)
Expert Solution
This question has been solved!
Explore an expertly crafted, step-by-step solution for a thorough understanding of key concepts.
Step by stepSolved in 2 steps

Knowledge Booster
Similar questions
- Find the mean hourly cost when the cell phone described above is used for 240 minutes.arrow_forwardthe following table provides the average price of regular grade gasoline for 4 years. Use 2015 as the reference value, complete the table by calculating the price index for each year. Show all your calculationarrow_forwardIn 2014, the median salary nationwide for a high school teacher was $56,310 per year. The median annual wage for all workers was $35,540.SOURCE: United States. Department of Labor. "High School Teachers." Occupational Outlook Handbook. 17 Dec. 2015. Web. 7 March 2016. Suppose a worker makes $29,000 in wages per year. Find the percent increase in salary the worker can expect if he/she trains to be a teacher and can expect to earn a salary of $40,000. Enter your response to the nearest 0.1% %arrow_forward
- Official unemployment rates for the U.S. population are reportedon a monthly basis by the Bureau of Labor Statistics.For the period October, 2011, through January, 2012, theofficial unemployment rates were 8.9% (Oct.), 8.7% (Nov.),8.5% (Dec.), and 8.3% (Jan.). (Source: U.S. Bureau of LaborStatistics, www.bls.gov.) If the unemployment rateswere to continue to decrease following a linear model,(a) predict the unemployment rate on January, 2013.(b) predict when the United States would reach a zero unemploymentrate.arrow_forwardThe following data report total, monthly U.S. book-store sales in millions of dollars from January 2016 to March 2019. (Go to https://www.census.gov/retail/index.html#mrts, find “Monthly Retail Trade Report,” then select “Time Series/Trend Charts” to find the data for the total U.S. bookstore sales.)YearMonth 2016 2017 2018 2019January $1,468 $1,386 $1,271 $1,144February 727 691 709 666March 719 707 734 685April 709 729 710May 778 781 787June 713 704 727July 687 669 701August 1,524 1,374 1,364September 1,064 997 986October 715 689 741November 742 703 768December 1,256 1,157 1,259 g. Predict book sales for the next 9 months. (Round your answers to 4 decimal places.)Year Month Forecast…arrow_forwardThe following data report total, monthly U.S. book-store sales in millions of dollars from January 2016 to March 2019. (Go to https://www.census.gov/retail/index.html#mrts, find “Monthly Retail Trade Report,” then select “Time Series/Trend Charts” to find the data for the total U.S. bookstore sales.)YearMonth 2016 2017 2018 2019January $1,468 $1,386 $1,271 $1,144February 727 691 709 666March 719 707 734 685April 709 729 710May 778 781 787June 713 704 727July 687 669 701August 1,524 1,374 1,364September 1,064 997 986October 715 689 741November 742 703 768December 1,256 1,157 1,259 c. Which forecasting model is appropriate based on the data for the total U.S. bookstore sales?Appropriate model____________d. Evaluate a seasonally adjusted trend…arrow_forward
- The median home value in West Virginia and Rhode Island (adjusted for Inflation) are shown below.arrow_forwardFind the Fan Cost Index for the New York Knicks. Team Ticket Other Drink Soft Drink Hot Dog Parking Hat FCI NY Knicks $190 $11.50 $8 $6 $30 $31arrow_forwardSuppose the marketing manager who was earning $129,420 got a raise and is now earning $140,000. Indicate how this change would affect the median of summary statistics. Increase Decrease Stay the same DonÕt knowarrow_forward
- Find the Fan Cost Index for the New York Giants. Team Ticket Soft Drink Other Drink Hot Dog Parking Hat FCINew York Giants $123.40 $3.00 $9.50 $6.00 $30.00 $24.95arrow_forwardAnswer the following questions regarding the population of Hamilton County in 2016. a. If you predict the population of Hamilton County in 2016, should you use the average growth rate of 2000-2009 or the average growth rate of 2009-2015? Explain your choice in a complete sentence. b. Predict the population of Hamilton Country in 2016. Show your work. Express your answer in “thousand people” rounded to the nearest whole number.arrow_forwardUse a graphing calculator to make a scatter plot of the amounts Leah willaccumulate for years 1 through 5.arrow_forward
arrow_back_ios
SEE MORE QUESTIONS
arrow_forward_ios
Recommended textbooks for you
 Glencoe Algebra 1, Student Edition, 9780079039897...AlgebraISBN:9780079039897Author:CarterPublisher:McGraw Hill
 College Algebra (MindTap Course List)AlgebraISBN:9781305652231Author:R. David Gustafson, Jeff HughesPublisher:Cengage Learning
 Big Ideas Math A Bridge To Success Algebra 1: Stu...AlgebraISBN:9781680331141Author:HOUGHTON MIFFLIN HARCOURTPublisher:Houghton Mifflin Harcourt

Glencoe Algebra 1, Student Edition, 9780079039897...
Algebra
ISBN:9780079039897
Author:Carter
Publisher:McGraw Hill

College Algebra (MindTap Course List)
Algebra
ISBN:9781305652231
Author:R. David Gustafson, Jeff Hughes
Publisher:Cengage Learning

Big Ideas Math A Bridge To Success Algebra 1: Stu...
Algebra
ISBN:9781680331141
Author:HOUGHTON MIFFLIN HARCOURT
Publisher:Houghton Mifflin Harcourt