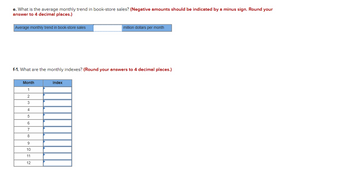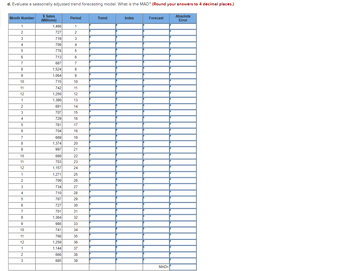
The following data report total, monthly U.S. book-store sales in millions of dollars from January 2016 to March 2019. (Go to https://www.census.gov/retail/index.html#mrts, find “Monthly Retail Trade Report,” then select “Time Series/Trend Charts” to find the data for the total U.S. bookstore sales.)
Year
Month 2016 2017 2018 2019
January $1,468 $1,386 $1,271 $1,144
February 727 691 709 666
March 719 707 734 685
April 709 729 710
May 778 781 787
June 713 704 727
July 687 669 701
August 1,524 1,374 1,364
September 1,064 997 986
October 715 689 741
November 742 703 768
December 1,256 1,157 1,259
g. Predict book sales for the next 9 months. (Round your answers to 4 decimal places.)
Year Month Forecast Sales
2019 April
2019 May
2019 June
2019 July
2019 August
2019 September
2019 October
2019 November
2019 December


Trending nowThis is a popular solution!
Step by stepSolved in 5 steps with 21 images

- The mean of 14 numbers in a data set is 43. A new number is included in the data set. It changes the mean to 44. What is the new number? Record the result below accurate to two decimal places.arrow_forwardWhat is the approximate forecast for November using a four-month moving average? Oct - 700Sept - 600Aug - 880July - 670June - 430arrow_forwardFind the Fan Cost Index for the New York Knicks. Team Ticket Other Drink Soft Drink Hot Dog Parking Hat FCI NY Knicks $190 $11.50 $8 $6 $30 $31arrow_forward
- Add the means and divide them by two for each pre-1945 and post-1945 and make an excel bar graph based off this data with error bars on grapharrow_forwardThe national center for educational statistics reported that in 2008-2009, 178,564 master's degrees in education were awarded in the United States, and that this represented 27% of all master's degrees awarded. How many master's degrees were awarded in 2008-2009?arrow_forwardfind population sd 12,15,18,16,19,22,23,25,28arrow_forward
- What percentage change in the total and Hispanic populations occurred in each state between 2000 and 2010?arrow_forwardThe following data report total, monthly U.S. gasoline sales in millions of dollars from January 2017 toDecember 2018. (To find the data, go to the site https://www.census.gov/retail/index.html#mrts, find“Monthly Retail Trade Report,” then select “Time Series/Trend Charts.”)Year Month Sales ($ millions)2017 Jan $35,6302017 Feb 33,9722017 Mar 38,6222017 Apr 38,9732017 May 40,7392017 Jun 40,0092017 Jul 39,7972017 Aug 41,2172017 Sep 41,3462017 Oct 41,7172017 Nov 40,1862017 Dec 40,0462018 Jan 39,2232018 Feb 37,3772018 Mar 42,6482018 Apr 43,1092018 May 48,0492018 Jun 47,5462018 Jul…arrow_forwardThe Nenana Ice Classic is an annual contest to guess the exact time in the spring thaw when a tripod erected on the frozen. Tanana River near Nenana, Alaska, will fall through the ice. The contest has been run since 1917. The 2017 jackpot was $267,444. The table gives simplified data that record only the date on which the tripod fell each year. The earliest date so far is April 20. To make the data casier to use, the table gives the date each year in days starting with April 20. That is, April 20 is 1, April 21 is 2, and so on. Days from April 20 for the Tanana River tripod to fall Duy Year 1917 1918 1919 1920 1921 1922 1923 1924 1925 1926 1927 1928 1929 1930 1931 1932 1933 Year 1948 1969 1970 1971 1972 1973 1974 1975 1976 1977 1978 1979 1980 1981 1982 Days from April 20 for the Tanana River tripod to fall 1983 11 1984 22 14 22 22 23 20 22 16 7 23 17 16 19 21 12 19 Day 19 9 15 19 21 15 17 21 17 11. 11 10 11 21 10 20 Days from April 20 for the Tanana River tripod to fall Year 1934 1935…arrow_forward
 MATLAB: An Introduction with ApplicationsStatisticsISBN:9781119256830Author:Amos GilatPublisher:John Wiley & Sons Inc
 Probability and Statistics for Engineering and th...StatisticsISBN:9781305251809Author:Jay L. DevorePublisher:Cengage Learning
 Statistics for The Behavioral Sciences (MindTap C...StatisticsISBN:9781305504912Author:Frederick J Gravetter, Larry B. WallnauPublisher:Cengage Learning
 Elementary Statistics: Picturing the World (7th E...StatisticsISBN:9780134683416Author:Ron Larson, Betsy FarberPublisher:PEARSON
 The Basic Practice of StatisticsStatisticsISBN:9781319042578Author:David S. Moore, William I. Notz, Michael A. FlignerPublisher:W. H. Freeman
 Introduction to the Practice of StatisticsStatisticsISBN:9781319013387Author:David S. Moore, George P. McCabe, Bruce A. CraigPublisher:W. H. Freeman


