
Glencoe Algebra 1, Student Edition, 9780079039897, 0079039898, 2018
18th Edition
ISBN: 9780079039897
Author: Carter
Publisher: McGraw Hill
expand_more
expand_more
format_list_bulleted
Related questions
Question
Using SAS
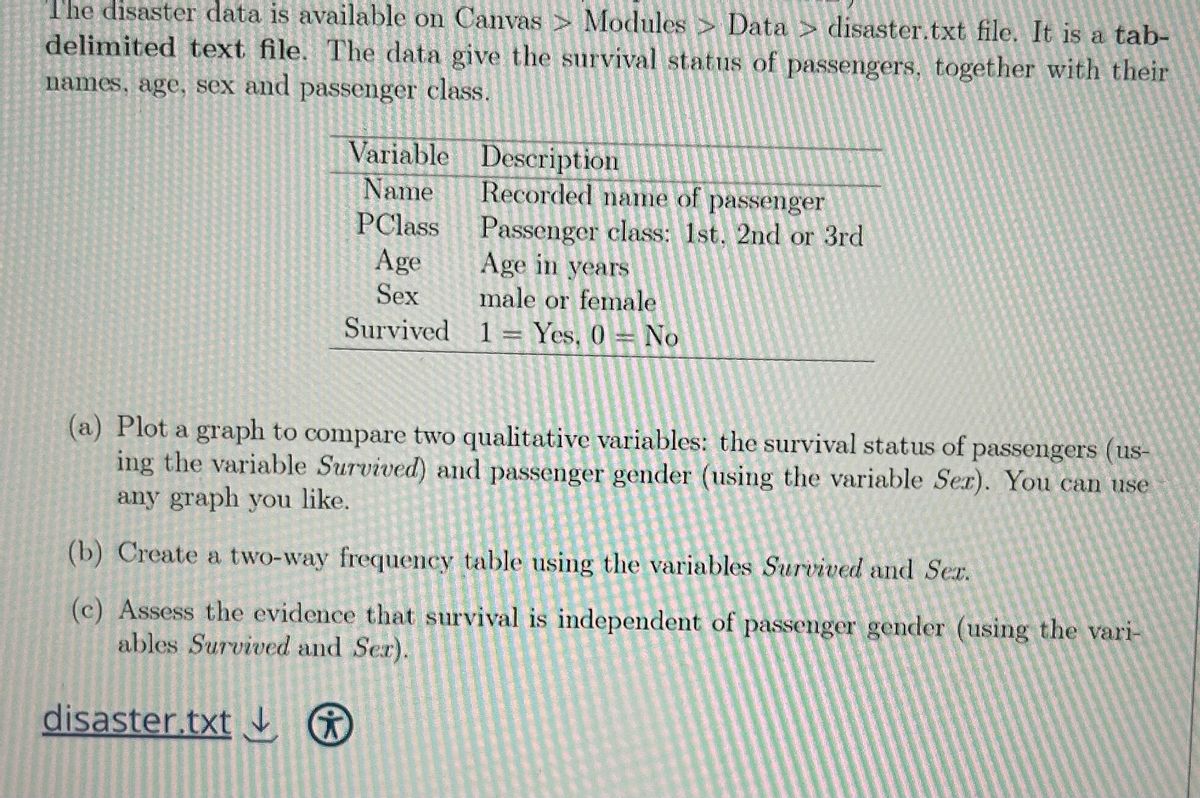

Transcribed Image Text:The disaster data is available on Canvas Modules Data > disaster.txt file. It is a tab-
delimited text file. The data give the survival status of passengers, together with their
names, age, sex and passenger class.
Variable
Description
Recorded name of passenger
Name
PClass
Age
Sex
Survived
Passenger class: 1st. 2nd or 3rd
Age in years
male or female
1 = Yes, 0 No
(a) Plot a graph to compare two qualitative variables: the survival status of passengers (us-
ing the variable Survived) and passenger gender (using the variable Sex). You can use
any graph you like.
(b) Create a two-way frequency table using the variables Survived and Sex.
(c) Assess the evidence that survival is independent of passenger gender (using the vari-
ables Survived and Sex).
disaster.txt ⑦
Expert Solution
This question has been solved!
Explore an expertly crafted, step-by-step solution for a thorough understanding of key concepts.

Step by stepSolved in 2 steps with 1 images

Knowledge Booster

Similar questions
- So I'll include a line graph for a second visual aid. I have a chart to show the proportion of students by major that have student loan debt at our school.arrow_forwardDescribe the three primary charts and graphs used to organize and display data.arrow_forwardCreate a line graph of the data using Excel. For how many of the years was the deficit greater than or equal to $320 million?arrow_forward
- Graph the interaction. On the “Category Axis” box put “maternal diet”. On the “Define Lines by” box put “age. Paste the graph into a word document and upload the file.arrow_forwardA pediatrician records the age x (in yr) and average height y (in inches) for girls between the ages of 2 and 10. Height of Girls vs. Age 50- 40- (4,38) 30- 10- 0 Age(yr) Part: 0 / 4 Part 1 of 4 (a) Use the points (4, 38) and (8, 50) to write a linear model for these data. X y = Skip Part Check Height (in.) (8,50) Ⓒ2022 McGraw Hill LLC. All Rights Reserve Aarrow_forwardSelect your answers from the drop-down lists.arrow_forward
- What would be a suitable chart type to show the proportions of the sales by products?arrow_forwardThe data represent the cost, return on investment, and graduation rate for a random sample of fifty colleges or universities in the United States. The data is from payscale.com. The variable "Cost" represents the four-year cost including tuition, supplies, room and board of attending the school. The variable "Annual ROI" represents the return on investment for graduates of the school. It essentially represents how much you would earn on the investment of attending the school. The variable "Grad Rate" represents the graduation rate of the school. Complete parts (a) and (b) below. Click here to view the school data. Click here to view the table of critical values of the correlation coefficient. (a) Describe the association between Cost and Graduation Rate graphically by drawing a scatter diagram, treating Cost as the explanatory variable. Describe the association between Cost and Graduation Rate by finding the linear correlation between the two variables. Is there a linear association…arrow_forwardDraw a scatter diagram with square feet of living space as the independent variable and selling price as the dependent variable and describe variable and describe the relationship between the size of a house and the selling price.arrow_forward
arrow_back_ios
SEE MORE QUESTIONS
arrow_forward_ios
Recommended textbooks for you
- Glencoe Algebra 1, Student Edition, 9780079039897...AlgebraISBN:9780079039897Author:CarterPublisher:McGraw Hill
 Holt Mcdougal Larson Pre-algebra: Student Edition...AlgebraISBN:9780547587776Author:HOLT MCDOUGALPublisher:HOLT MCDOUGAL
Glencoe Algebra 1, Student Edition, 9780079039897...
Algebra
ISBN:9780079039897
Author:Carter
Publisher:McGraw Hill
Holt Mcdougal Larson Pre-algebra: Student Edition...
Algebra
ISBN:9780547587776
Author:HOLT MCDOUGAL
Publisher:HOLT MCDOUGAL