
MATLAB: An Introduction with Applications
6th Edition
ISBN: 9781119256830
Author: Amos Gilat
Publisher: John Wiley & Sons Inc
expand_more
expand_more
format_list_bulleted
Related questions
Question
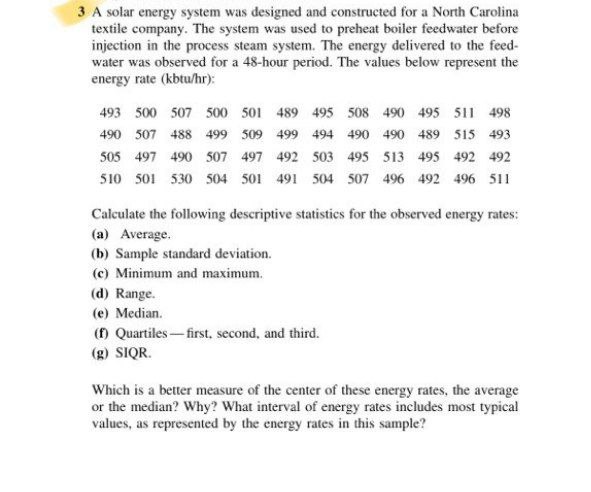

Transcribed Image Text:3 A solar energy system was designed and constructed for a North Carolina
textile company. The system was used to preheat boiler feedwater before
injection in the process steam system. The energy delivered to the feed-
water was observed for a 48-hour period. The values below represent the
energy rate (kbtu/hr):
493 500 507 500 501 489 495 508 490 495 511 498
490 507 488 499 509 499 494 490 490 489 515 493
505 497 490 507 497 492 503 495 513 495 492 492
510 501 530 504 501 491 504 507 496 492 496 511
Calculate the following descriptive statistics for the observed energy rates:
(a) Average.
(b) Sample standard deviation.
(c) Minimum and maximum.
(d) Range.
(e) Median.
(f) Quartiles-first, second, and third.
(g) SIQR.
Which is a better measure of the center of these energy rates, the average
or the median? Why? What interval of energy rates includes most typical
values, as represented by the energy rates in this sample?
Expert Solution
This question has been solved!
Explore an expertly crafted, step-by-step solution for a thorough understanding of key concepts.

Step by stepSolved in 2 steps

Knowledge Booster

Similar questions
- Rivers in North Carolina contain small concentrations of mercury that can accumulate in fish over their lifetimes. The concentration of mercury in fish tissue can be obtained by catching fish and sending samples to a lab for analysis. A study was conducted on fish from the Waccamaw and Lumber Rivers to investigate mercury levels in tissues of largemouth bass. At several stations along each river a group of fish were caught, weighed and measured; in addition a filet from each fish was sent to a lab so that the tissue concentration of mercury could be determined. In all, 171 fish were caught at 15 different research stations along the Waccamaw and Lumber Rivers. Data from fish caught at one of these stations is shown in the followinng table: length weight 1616 47.0 48.7 1862 2855 55.7 45.2 1199 1320 44.7 1225 43.8 870 38.5 1455 45.8 1220 44.0 1033 40.4 Compute the correlation between length and weight for these fish. (Assume the correlation conditions have been satisfied and round your…arrow_forwardRadon is a gas emitted from the ground that can collect in houses in buildings. At certain levels it can cause lung cancer. Radon concentrations are measured in picocuries per liter (pCi/L). A radon level of 4 pCi/L is considered “acceptable” Radon levels in a house vary from week to week. In one house, a sample of 6 weeks had the following readings for radon level (in pCi/L): 1.9 2.8 3.9 3.9 4.2 5.7 Find the variance and standard deviation (definitional formula). Show your work using a table.arrow_forwardYou are interested in the relationship between gender and violent victimization. You have the data below: Victimization No Yes Total Gender b. Interpret Lambda. Male 150 50 200 Female 190 10 200 Total 340 60 400 a. Calculate Lambda. If needed, take a picture of your work and insert directly into the workspace.arrow_forward
- numerical 1 Gblam he Amerat Vahes ij,k=1,2,3 = Delta. %3D E= epsilon Eppe akarrow_forwardWeatherwise is a magazine published by the American Meteorological Society. One issue gives a rating system used to classify Nor'easter storms that frequently hit New England and can cause much damage near the ocean. A severe storm has an average peak wave height of u = 16.4 feet for waves hitting the shore. Suppose that a Nor'easter is in progress at the severe storm class rating. Peak wave heights are usually measured from land (using binoculars) off fixed cement piers. Suppose that a reading of 36 waves showed an average wave height of x = 16.9 feet. Previous studies of severe storms indicate that o = 3.5 feet. Does this information suggest that the storm is (perhaps temporarily) increasing above the severe rating? Use a = 0.01. (a) What is the level of significance? State the null and alternate hypotheses. O Ho: H = 16.4 ft; H,: µ > 16.4 ft O Ho: H 16.4 ft; H,: µ = 16.4 ft (b) What sampling distribution will you use? Explain the rationale for your choice of sampling distribution.…arrow_forwardWeatherwise is a magazine published by the American Meteorological Society. One issue gives a rating system used to classify Nor'easter storms that frequently hit New England and can cause much damage near the ocean. A severe storm has an average peak wave height of μ = 16.4 feet for waves hitting the shore. Suppose that a Nor'easter is in progress at the severe storm class rating. Peak wave heights are usually measured from land (using binoculars) off fixed cement piers. Suppose that a reading of 40 waves showed an average wave height of x = 16.9 feet. Previous studies of severe storms indicate that σ = 3.5 feet. Does this information suggest that the storm is (perhaps temporarily) increasing above the severe rating? Use α = 0.01. (a) What is the level of significance?State the null and alternate hypotheses. H0: μ = 16.4 ft; H1: μ < 16.4 ftH0: μ > 16.4 ft; H1: μ = 16.4 ft H0: μ < 16.4 ft; H1: μ = 16.4 ftH0: μ = 16.4 ft; H1: μ > 16.4 ftH0: μ = 16.4 ft; H1: μ ≠ 16.4 ft…arrow_forward
arrow_back_ios
arrow_forward_ios
Recommended textbooks for you
- MATLAB: An Introduction with ApplicationsStatisticsISBN:9781119256830Author:Amos GilatPublisher:John Wiley & Sons Inc
 Probability and Statistics for Engineering and th...StatisticsISBN:9781305251809Author:Jay L. DevorePublisher:Cengage Learning
 Statistics for The Behavioral Sciences (MindTap C...StatisticsISBN:9781305504912Author:Frederick J Gravetter, Larry B. WallnauPublisher:Cengage Learning
  Elementary Statistics: Picturing the World (7th E...StatisticsISBN:9780134683416Author:Ron Larson, Betsy FarberPublisher:PEARSON
 The Basic Practice of StatisticsStatisticsISBN:9781319042578Author:David S. Moore, William I. Notz, Michael A. FlignerPublisher:W. H. Freeman
 Introduction to the Practice of StatisticsStatisticsISBN:9781319013387Author:David S. Moore, George P. McCabe, Bruce A. CraigPublisher:W. H. Freeman
MATLAB: An Introduction with Applications
Statistics
ISBN:9781119256830
Author:Amos Gilat
Publisher:John Wiley & Sons Inc
Probability and Statistics for Engineering and th...
Statistics
ISBN:9781305251809
Author:Jay L. Devore
Publisher:Cengage Learning
Statistics for The Behavioral Sciences (MindTap C...
Statistics
ISBN:9781305504912
Author:Frederick J Gravetter, Larry B. Wallnau
Publisher:Cengage Learning
Elementary Statistics: Picturing the World (7th E...
Statistics
ISBN:9780134683416
Author:Ron Larson, Betsy Farber
Publisher:PEARSON
The Basic Practice of Statistics
Statistics
ISBN:9781319042578
Author:David S. Moore, William I. Notz, Michael A. Fligner
Publisher:W. H. Freeman
Introduction to the Practice of Statistics
Statistics
ISBN:9781319013387
Author:David S. Moore, George P. McCabe, Bruce A. Craig
Publisher:W. H. Freeman