
MATLAB: An Introduction with Applications
6th Edition
ISBN: 9781119256830
Author: Amos Gilat
Publisher: John Wiley & Sons Inc
expand_more
expand_more
format_list_bulleted
Related questions
Question
Suppose the following are the seasonal indices for the first three quarters of the year for a quarterly series:
Remember that the seasonal indices should average 100 so you should be able to infer the seasonal index for Q4.
Furthermore, suppose that the estimated coefficients from a regression of the deseasonalized series on Time are given below:
If the original value of the series in a Q4 was 2494, then what is the seasonally adjusted value? (please round your answer to 1 decimal place)
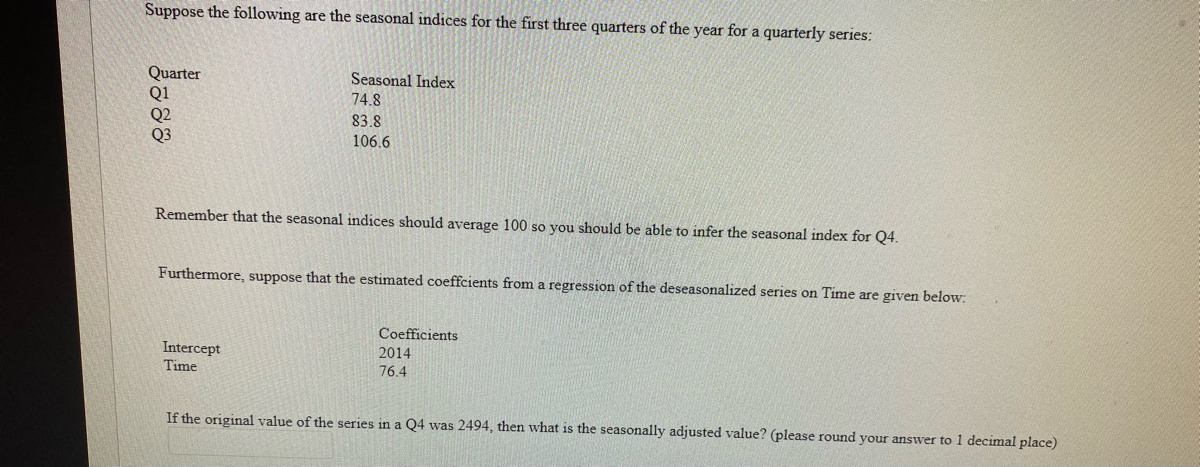

Transcribed Image Text:Suppose the following are the seasonal indices for the first three quarters of the year for a quarterly series:
Quarter
Q1
Q2
Q3
Seasonal Index
74.8
83.8
106.6
Remember that the seasonal indices should average 100 so you should be able to infer the seasonal index for Q4.
Furthermore, suppose that the estimated coeffcients from a regression of the deseasonalized series on Time are given below:
Coefficients
Intercept
Time
2014
76.4
If the original value of the series in a Q4 was 2494, then what is the seasonally adjusted value? (please round your answer to 1 decimal place)
Expert Solution
This question has been solved!
Explore an expertly crafted, step-by-step solution for a thorough understanding of key concepts.

This is a popular solution

Trending nowThis is a popular solution!

Step by stepSolved in 2 steps with 2 images

Knowledge Booster

Similar questions
- Suppose the following are the seasonal indices for the first three quarters of the year for a quarterly series: Quarter Seasonal Index Q1 70.3 Q2 81.4 Q3 107 Remember that the seasonal indices should average 100 so you should be able to infer the seasonal index for Q4. Furthermore, suppose that the estimated coeffcients from a regression of the deseasonalized series on Time are given below: Coefficients Intercept 2,345 Time 62.4 What is the forecast for period 104, if period 104 is a Q4? (please round your answer to 1 decimal placearrow_forwardSuppose the following are the seasonal indices for the first three quarters of the year for a quarterly series: Quarter Seasonal Index Q1 73.7 Q2 82.5 Q3 108.1 Remember that the seasonal indices should average 100 so you should be able to infer the seasonal index for Q4. Furthermore, suppose that the estimated coeffcients from a regression of the deseasonalized series on Time are given below: Coefficients Intercept 2,733 Time 65.8 If the original value of the series in a Q4 was 2,197, then what is the seasonally adjusted value?arrow_forwardWhich of the following is a DISADVANTAGE of using a moving average technique todetermine time series trend?A.The trend values obtained do not reflect thegeneral trend.B.Only one trend value can be obtained foreither of the end points of the series.C.No trend values are obtained for thebeginning and end time points of the series.D.Each moving average trend value obtaineddoes not correspond with a time pointarrow_forward
- It is claimed that Table 6 represents the seasonal factors obtained from a quarterly time series. Table 6 Quarter 1 2 3 4 Explain why this claim cannot be correct. Seasonal Factor -203.4 -81.6 24.1 -260.9arrow_forwardExplain the various concepts & tools of regression with time series data?arrow_forward11) The following data are US exports to Mexico. Complete the missing values. YOU WILL NEED TO USE THE REGRESSION RESULTS BELOW TO HELP COMPLETE THE TABLE ABOVE. a) Fill in the table. b) Note that the Adjusted Seasonal Index for March is 112.7. What does this number mean? To estimate the Trend, a regression of the Seasonally Adjusted Series on a trend yielded the following results. c) What is your forecast of US Exports to Mexico for March 2005 (which would be the 50th observation)?arrow_forward
arrow_back_ios
arrow_forward_ios
Recommended textbooks for you
- MATLAB: An Introduction with ApplicationsStatisticsISBN:9781119256830Author:Amos GilatPublisher:John Wiley & Sons Inc
 Probability and Statistics for Engineering and th...StatisticsISBN:9781305251809Author:Jay L. DevorePublisher:Cengage Learning
 Statistics for The Behavioral Sciences (MindTap C...StatisticsISBN:9781305504912Author:Frederick J Gravetter, Larry B. WallnauPublisher:Cengage Learning
  Elementary Statistics: Picturing the World (7th E...StatisticsISBN:9780134683416Author:Ron Larson, Betsy FarberPublisher:PEARSON
 The Basic Practice of StatisticsStatisticsISBN:9781319042578Author:David S. Moore, William I. Notz, Michael A. FlignerPublisher:W. H. Freeman
 Introduction to the Practice of StatisticsStatisticsISBN:9781319013387Author:David S. Moore, George P. McCabe, Bruce A. CraigPublisher:W. H. Freeman
MATLAB: An Introduction with Applications
Statistics
ISBN:9781119256830
Author:Amos Gilat
Publisher:John Wiley & Sons Inc
Probability and Statistics for Engineering and th...
Statistics
ISBN:9781305251809
Author:Jay L. Devore
Publisher:Cengage Learning
Statistics for The Behavioral Sciences (MindTap C...
Statistics
ISBN:9781305504912
Author:Frederick J Gravetter, Larry B. Wallnau
Publisher:Cengage Learning
Elementary Statistics: Picturing the World (7th E...
Statistics
ISBN:9780134683416
Author:Ron Larson, Betsy Farber
Publisher:PEARSON
The Basic Practice of Statistics
Statistics
ISBN:9781319042578
Author:David S. Moore, William I. Notz, Michael A. Fligner
Publisher:W. H. Freeman
Introduction to the Practice of Statistics
Statistics
ISBN:9781319013387
Author:David S. Moore, George P. McCabe, Bruce A. Craig
Publisher:W. H. Freeman