
MATLAB: An Introduction with Applications
6th Edition
ISBN: 9781119256830
Author: Amos Gilat
Publisher: John Wiley & Sons Inc
expand_more
expand_more
format_list_bulleted
Related questions
Question
1) The following data are US exports to Mexico. Complete the missing values.
a) Fill in the table.
b) Note that the Adjusted Seasonal Index for March is 112.7. What does this number mean?
To estimate the Trend, a regression of the Seasonally Adjusted Series on a trend yielded the following results.
c) What is your forecast of US Exports to Mexico for March 2005 (which would be the 50th observation)?

Transcribed Image Text:15418.1
15188.8 105.7 noil ie 101.9
108.5
15755.5
15125.7
Aug-04
Sep-04
Oct-04
43
16060.0
15934.9
15194.1
15897.8
104.6
16673.0
15368.4
Jn 15262,5
15330.8
44
16875.0
SMat110,6
105.1
15352.9
o109.6
107.0
45
16975.0
15486.7
15951.9
16119.0
46
Nov-04
16772.0
15667.9
14846.9
96.4
16577.7
15399.2
47
Dec-04
15983.1
15847.0
100.9
94.0
16574.6
15467.6
14532.3
48
Jan-05
15572.3
16037.1
97.1
97.6
16523.6
15536.0
15163.0
49
Feb-05
16127.0
16185.9
99.6
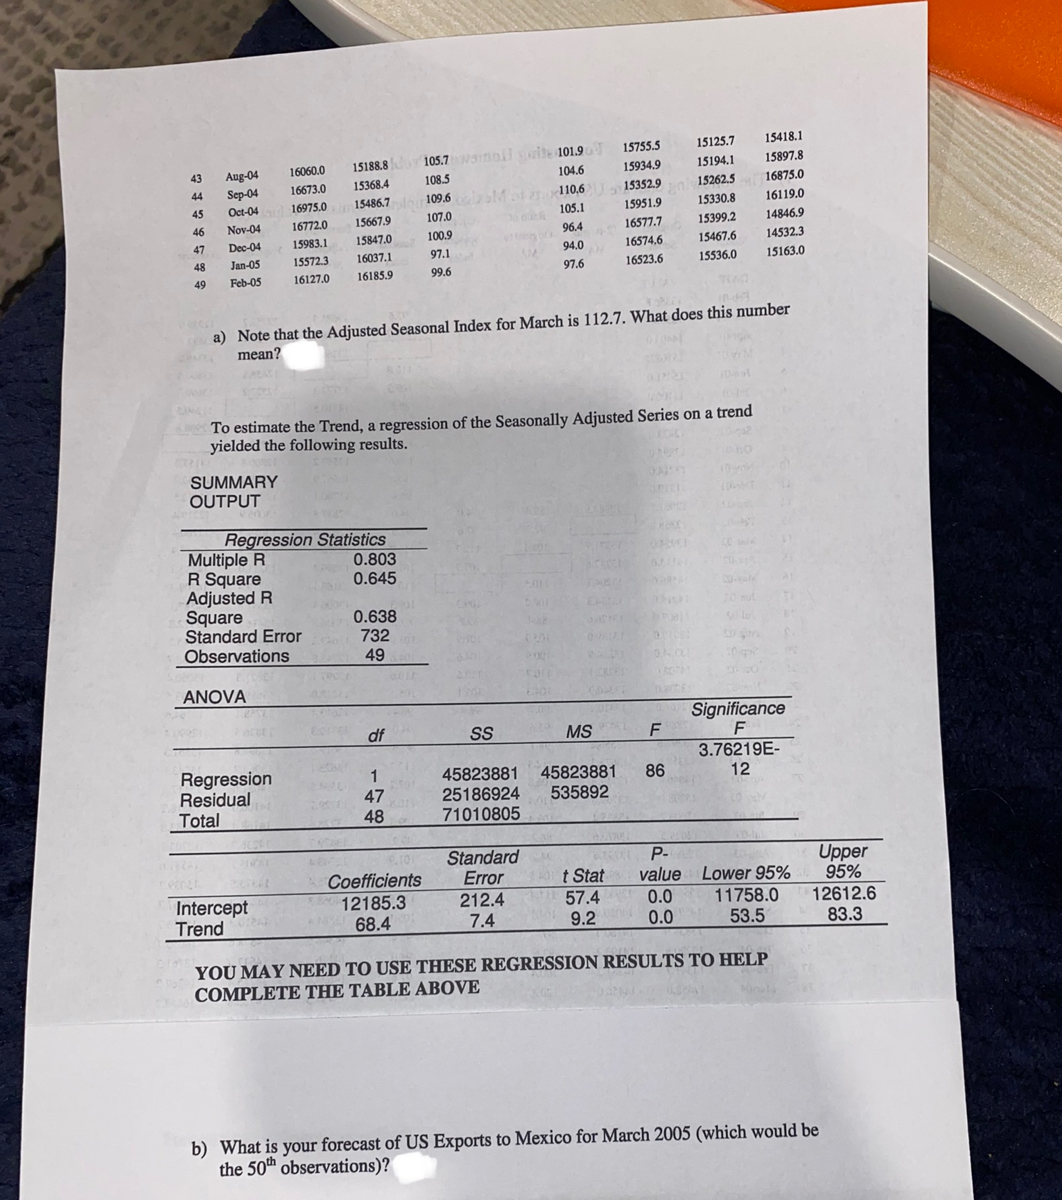
a) Note that the Adjusted Seasonal Index for March is 112.7. What does this number
mean?
To estimate the Trend, a regression of the Seasonally Adjusted Series on a trend
yielded the following results.
SUMMARY
OUTPUT
Regression Statistics
Multiple R
R Square
Adjusted R
Square
Standard Error
Observations
0.803
0.645
0.638
732
49
ANOVA
Significance
F
3.76219E-
df
SS
MS
Regression
Residual
Total
1
45823881
25186924
71010805
45823881
535892
86
12
47
48
Standard
Error
P-
Upper
95%
Coefficients
RA 12185.3
ANY
t Stat
value Lower 95%
Intercept
Trend
212.4
7.4
57.4
0.0
0.0
11758.0
12612.6
83.3
68.4
9.2
53.5
YOU MAY NEED TO USE THESE REGRESSION RESULTS TO HELP
COMPLETE THE TABLE ABOVE
b) What is your forecast of US Exports to Mexico for March 2005 (which would be
the 50th observations)?

Transcribed Image Text:128378
1) The following data are US exports to Mexico. Complete the missing values.
Seasonally
Adjusted
Ratio of
Adjusted
Trend
Original
12-month
Original to
Seasonal
Seasonal
Projection
Forecast
Month
Series
МА
МА
Index
Index
Series
DATE
VALUE
1
Feb-01
13356.8
97.6
13685.3
12253.7
11959.6
S or ol rabn len 112.7
2
Mar-01
15523.7
13768.7
12322.1
13892.7
3
Apr-01
14403.0
13368.6
12390.5
13349.2
4
Мay-01
15108.0
110.8
12458.8
13800.3
5
Jun-01
15051.0
109.3
13772.3
12527.2
13690.3
6.
Jul-01
11700.0
89.2
13110.5
11240.5
7
Aug-01
13764.0 anbA discoze ali to 101.9
13503.0
12664.0
12908.8
Sep-01
12423.0
104.6 11873.1
12732.4
9.
Oct-01
13895.0
110.6
12567.2
12800.8
14153.2
10
Nov-01
13214.0
105.1
12567.9
12869.1
13530.7
11
Dec-01
11319.0
96.4
11740.1
12937.5
12473.5
12
Jan-02
12061.5
13484,9
89.4
94.0
94.0
13005.9
12837.8
12219.4
13
Feb-02
12368.2
92.3
97.6
97.6
12672.4
13074.3
12760.4
14
Mar-02
13954.0
13271.7
105.1
112.7
112.7
12376.4
13142.7
14817.9
15
Apr-02
14113.0
13247.6
107.7
107.7
13099.4
19000
13211.0
14233.3
16
Мaу-02
14586.0
13204.1
110.5
110.8
13168.1
13279.4
14709.3
17
Jun-02
14214.0
13134.3
108.2
109.3
109.3
13006.4
13347.8
14587.1
18
Jul-02
11607.0
13126.6
88.4
89.2
89.2
13006.3
13416.2
11972.8
19
Aug-02
13913.0
13139.0
105.9
1O 13484.6
101.9
101.9
13649.2
13745.2
20
Sep-02
13334.0
13214.9
100.9
104.6
104.6
12743.8
13552.9
14180.7
21
Oct-02
14702.0
13282.1
110.7
110.6
110.6
13297.1
13621.3
15060.4
22
Nov-02
13908.0
13340.0
104.3
105.1
105.1
13228.0
13689.7
14393.5
23
Dec-02
12161.0
13410.1
90.7
96.4
96.4
12613.4
13758.1
13264.6
24
Jan-03
12889.7
13479.2
95.6
22
94.0
13719.3
13826.5
12990.4
25
Feb-03
13292.6
13556.2
98.1
97.6
13619.5
13894.8
13561.3
26
Mar-03
15359.6
13673.3
112.3
12.3
112.7
13623.1
13963.2
15743.1
27
Apr-03
14646.4
13717.8
106.8
107.7
13594.5
scoaras
108400O
14031.6
15117.3
28
Мay-03
15208.0
13769.6
110.4
15709.0
110.8
13729.7
14100.0
29
Jun-03
15003.2
15618.2
13835.4
109.3
13728.6
14168.4
15483.8
30
Jul-03
12029.5
13870.6
86.7
89.2
13479.7
14236.7
hegou 31
e 32
12705.1
12989.7
Sep-03N 14518.1
94.2 sbnsie
Aug-03
13793.6
101.9
12743.4
14305.1
14581.6
13892.3
104.5
104.6
13875.4
14373.5
15039.2
33
Oct-03
15554.6
13963.4
111.4
110.6 S 14068.3
34
Nov-03
14598,2
14441.9
15967.7
14020.9
104.1
105.1
13884.4
35
Dec-03
13834.0
14160.3
14510.3
15256.2
97.7
96.4
14348.6
14578.6
36
Jan-04
13290.8
14193.7
93.6
14055.7
94.0
14146.2
14647.0
37
Feb-04
14341.7
14281.2
100.4
13761.3
38
Mar-04
97.6
14694.4
14715,4
14362.2
THOAE
112.7
107.7
17458.0
14456.0
120.8
39
Apr-04
16014.0
14570.0
15484.3
14783.8
16668.2
109.9
40
Мay-04
16334.0
14663.8
14863.9
14852.2
16001.4
111.4
41
Jun-04
16438.0
110.8
14746.2
14920.5
16527.1
14783,4
111.2
42
Jul-04
109.3
15041,5
14988.9
16380.6
13824.0
14932.9
92.6
89.2
15490.6
15057.3
13437.4
Expert Solution
This question has been solved!
Explore an expertly crafted, step-by-step solution for a thorough understanding of key concepts.

This is a popular solution

Trending nowThis is a popular solution!

Step by stepSolved in 3 steps with 3 images

Knowledge Booster

Similar questions
- question 3arrow_forwardSuppose that a firm's sales were $3,750,000 five years ago and are $5,250,000 today. What was the geometric mean growth rate in sales over the past five years?arrow_forward11) The following data are US exports to Mexico. Complete the missing values. YOU WILL NEED TO USE THE REGRESSION RESULTS BELOW TO HELP COMPLETE THE TABLE ABOVE. a) Fill in the table. b) Note that the Adjusted Seasonal Index for March is 112.7. What does this number mean? To estimate the Trend, a regression of the Seasonally Adjusted Series on a trend yielded the following results. c) What is your forecast of US Exports to Mexico for March 2005 (which would be the 50th observation)?arrow_forward
- If a trend line had the equation y=2.4x-0.15, what y-value would you expect to obtain when x has the following values? BUB 5: a. 2 a. When x = 2, y = (Type an integer or decimal rounded to the nearest hundredth as needed.) b. 0 b. When x = 0, y = (Type an integer or decimal rounded to the nearest hundredth as needed.). 2 c. 12 c. When x = 12, y = (Type an integer decimal rounded to the nearest hundredth as needed.) o F2 d. When x = 20.5, y = (Type an integer or decimal rounded to the nearest hundredth as needed.). W #3 d. 20.5 2 20 F3 E $ 4 F4 R 67 50 % 5 F5 T MacBook Air A 6 F6 Y & 7 F7 * U 00 Time Remaining. FB tv (arrow_forwardyour car is more crowded than you think. table 5.8 reports results from a 1969 personal transportation survey on "home-to-work" trips in metropolitan areas. The survey stated that the average car occupancy was 1.4 people. check that calculation.arrow_forward
arrow_back_ios
arrow_forward_ios
Recommended textbooks for you
- MATLAB: An Introduction with ApplicationsStatisticsISBN:9781119256830Author:Amos GilatPublisher:John Wiley & Sons Inc
 Probability and Statistics for Engineering and th...StatisticsISBN:9781305251809Author:Jay L. DevorePublisher:Cengage Learning
 Statistics for The Behavioral Sciences (MindTap C...StatisticsISBN:9781305504912Author:Frederick J Gravetter, Larry B. WallnauPublisher:Cengage Learning
  Elementary Statistics: Picturing the World (7th E...StatisticsISBN:9780134683416Author:Ron Larson, Betsy FarberPublisher:PEARSON
 The Basic Practice of StatisticsStatisticsISBN:9781319042578Author:David S. Moore, William I. Notz, Michael A. FlignerPublisher:W. H. Freeman
 Introduction to the Practice of StatisticsStatisticsISBN:9781319013387Author:David S. Moore, George P. McCabe, Bruce A. CraigPublisher:W. H. Freeman
MATLAB: An Introduction with Applications
Statistics
ISBN:9781119256830
Author:Amos Gilat
Publisher:John Wiley & Sons Inc
Probability and Statistics for Engineering and th...
Statistics
ISBN:9781305251809
Author:Jay L. Devore
Publisher:Cengage Learning
Statistics for The Behavioral Sciences (MindTap C...
Statistics
ISBN:9781305504912
Author:Frederick J Gravetter, Larry B. Wallnau
Publisher:Cengage Learning
Elementary Statistics: Picturing the World (7th E...
Statistics
ISBN:9780134683416
Author:Ron Larson, Betsy Farber
Publisher:PEARSON
The Basic Practice of Statistics
Statistics
ISBN:9781319042578
Author:David S. Moore, William I. Notz, Michael A. Fligner
Publisher:W. H. Freeman
Introduction to the Practice of Statistics
Statistics
ISBN:9781319013387
Author:David S. Moore, George P. McCabe, Bruce A. Craig
Publisher:W. H. Freeman