
MATLAB: An Introduction with Applications
6th Edition
ISBN: 9781119256830
Author: Amos Gilat
Publisher: John Wiley & Sons Inc
expand_more
expand_more
format_list_bulleted
Related questions
Question
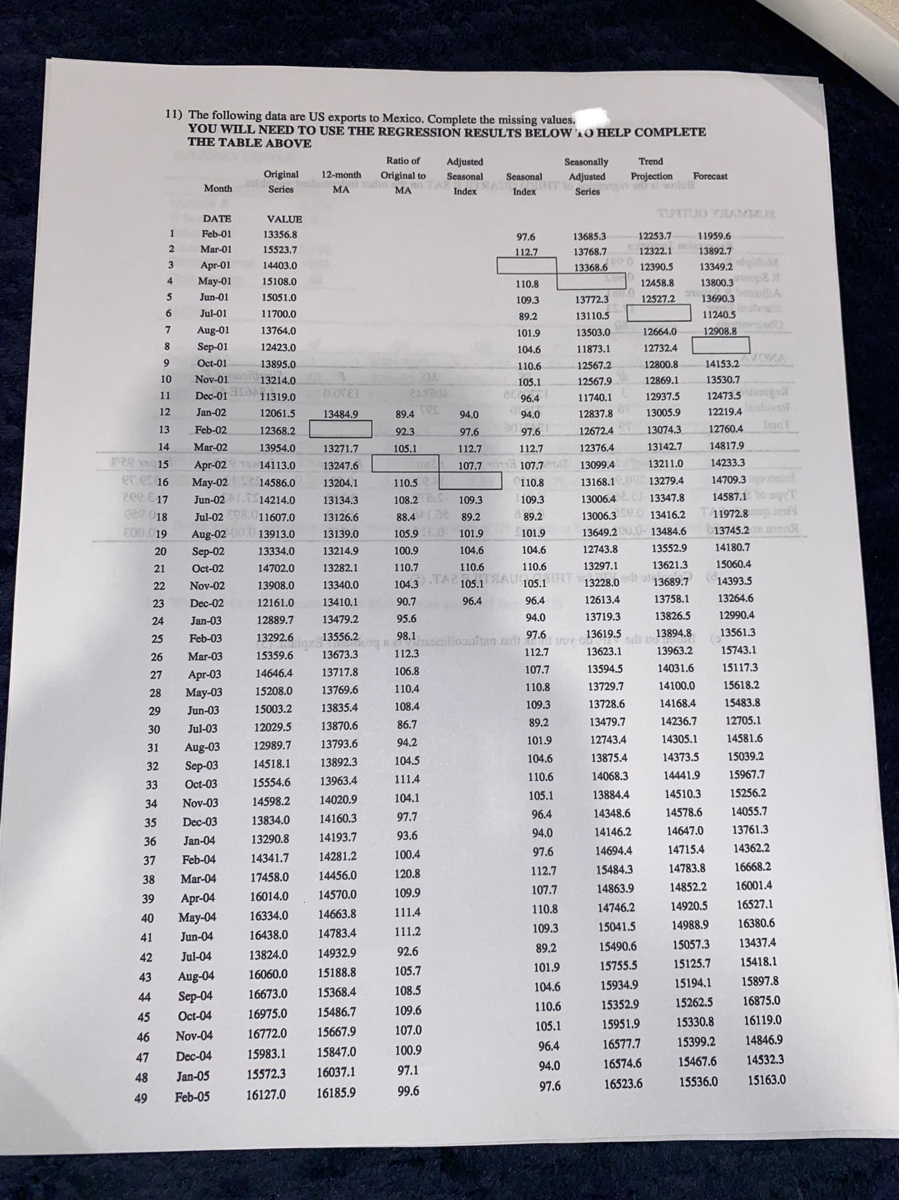
11) The following data are US exports to Mexico. Complete the missing values.
YOU WILL NEED TO USE THE REGRESSION RESULTS BELOW TO HELP COMPLETE THE TABLE ABOVE.
a) Fill in the table.
b) Note that the Adjusted Seasonal Index for March is 112.7. What does this number mean?
To estimate the Trend, a regression of the Seasonally Adjusted Series on a trend yielded the following results.
c) What is your forecast of US Exports to Mexico for March 2005 (which would be the 50th observation)?

Transcribed Image Text:11) The following data are US exports to Mexico. Complete the missing values.
YOU WILL NEED TO USE THE REGRESSION RESULTS BELOW 1O HELP COMPLETE
THE TABLE ABOVE
Ratio of
Seasonally
Adjusted
Adjusted
Trend
Original
12-month
Original to
Seasonal
Seasonal
Projection
Forecast
MA o
MA
Month
Series
Index
Index
Series
TUTTUO YAMMUR
DATE
VALUE
Feb-01
13356.8
97.6
13685.3
12253.7
11959.6
Mar-01
15523,7
112.7
13768.7
12322.1
13892.7
3
Apr-01
14403.0
13349.2 M
13368.6
12390.5
May-01
15108.0
110.8
12458.8
13800.3
A
Jun-01
Jul-01
15051.0
109.3
13772.3
12527.2
13690.3
6
11700.0
89.2
13110.5
11240.5
Aug-01
13764.0
101.9
13503.0
12664.0
12908.8
Sep-01
12423.0
104.6
11873.1
12732.4
9.
Oct-01
13895.0
12800.8
14153,2 OMA
110.6
12567.2
10
Nov-01
13214.0
105.1
12567.9
12869.1
13530.7
0.0TEI
12473.5
12219.4 s
IssoT
11
Dec-01
11319.0
96.4
11740.1
12937.5
12
Jan-02
12061.5
13484.9
89.4
94.0
94.0
12837.8
13005.9
13
Feb-02
12368.2
92.3
97.6
97.6
12672.4
13074.3
12760.4
14
Mar-02
13954.0
13271.7
105.1
112.7
112.7
12376.4
13142.7
14817.9
2R15
Apr-02
OW14113.0
13247.6
13211.0
14233.3
107.7
107.7
13099.4
eres 16
2e0.E 17
220.018
E00.019
14709.3 tal
14587.1o
11972.8 ri
13745.2 noos
Мay-02
14586.0
13204.1
110.5
110.8
13168.1
13279.4
Jun-02 14214.0
13134.3
108.2
- 109.3
109.3
13006.4 13347.8
Jul-028.011607.0
13126.6
88.4
89.2
89.2
13006.3 U 13416.2
Aug-02.0 13913.0
Sep-02
13139.0
105.9.0
101.9
13649.2 .0- 13484.6
101.9
20
13334.0
13214.9
100.9
104.6
104.6
12743.8
13552.9
14180.7
21
Oct-02
14702.0
13282.1
110.7
110.6
110.6
13297.1
13621.3
15060.4
104.3
TA2 105.1AUG05.1T 228.0
13689.7
14393.5
22
Nov-02
13908.0
13340.0
13228.0
23
Dec-02
12161.0
13410.1
90.7
96.4
96.4
12613.4
13758.1
13264.6
Jan-03
13479.2
95.6
94.0
13719.3
13826.5
12990.4
24
12889.7
13619.5
13894.8
13561.3
.6 13556.2ge 98.1nillooulun adt 7 uoe o
13623.1
25
Feb-03
13292.6
Mar-03
15359.6
13673.3
112.3
112.7
13963.2
15743.1
26
14646.4
13717.8
106.8
107.7
13594.5
14031.6
15117.3
27
Apr-03
15208.0
13769.6
110.4
110.8
13729.7
14100.0
15618.2
28
Мay-03
15003.2
13835.4
108.4
109.3
13728.6
14168.4
15483.8
29
Jun-03
12029.5
13870.6
86.7
89.2
13479.7
14236.7
12705.1
30
Jul-03
12989.7
13793.6
94.2
101.9
12743.4
14305.1
14581.6
31
Aug-03
104.5
104.6
13875.4
14373.5
15039.2
32
Sep-03
14518.1
13892.3
15554.6
13963.4
111.4
110.6
14068.3
14441.9
15967.7
33
Oct-03
105.1
13884.4
14510.3
15256.2
34
Nov-03
14598.2
14020.9
104.1
14160.3
97.7
96.4
14348.6
14578.6
14055.7
35
Dec-03
13834.0
94.0
14146.2
14647.0
13761.3
36
Jan-04
13290.8
14193.7
93.6
100.4
97.6
14694.4
14715.4
14362.2
37
Feb-04
14341.7
14281.2
112.7
15484.3
14783.8
16668.2
38
Mar-04
17458.0
14456.0
120.8
107.7
14863.9
14852.2
16001.4
16014.0
14570.0
109.9
Apr-04
May-04
39
110.8
14746.2
14920.5
16527.1
40
16334.0
14663.8
111.4
109.3
15041.5
14988.9
16380.6
41
Jun-04
16438.0
14783.4
111.2
89.2
15490.6
15057.3
13437.4
42
Jul-04
13824.0
14932.9
92.6
101.9
15755.5
15125.7
15418.1
15188.8
105.7
Aug-04
Sep-04
Oct-04
43
16060.0
104.6
15934.9
15194.1
15897.8
44
16673.0
15368.4
108.5
110.6
15352.9
15262.5
16875.0
16975.0
15486.7
109.6
45
105.1
15951.9
15330.8
16119.0
46
Nov-04
16772.0
15667.9
107.0
96.4
16577.7
15399.2
14846.9
47
Dec-04
15983.1
15847.0
100.9
94.0
16574.6
15467.6
14532.3
48
Jan-05
15572.3
16037.1
97.1
97.6
16523.6
15536.0
15163.0
49
Feb-05
16127.0
16185.9
99.6

Transcribed Image Text:ol obooob a om oil.otchoql 20 0 ol ovotun l
a) Note that the Adjusted Seasonal Index for March is 112.7. What does this number mean?
TUTTUO YE
ia no t
828.0
E.0
RelgiuM
To estimate the Trend, a regression of the Seasonally Adjusted Series on a trend yielded the following
results.
eest
SUMMARY
OUTPUT
101 bubnate
enoltevado
AVOWA
Regression Statistics
Multiple R
R Square 20-TS8 e
Adjusted R Square
Standard Error
Observations
0.803
0.645
0.638
2M
nolaaget
laubiesF
to T
sezasar
arseaerT
732
TA
49
bisbna
םרסר
ANOVA e 1owo.
eulov-9
selev00.0
20 df se
enoialteo0
00e0 Significanceatn
ISTS
ere.o
A MS
45823881
535892
SI8.0
ereo
Regression
Residual
3.76219E-12
45823881
25186924
Total S doalM oi ooixsM 48oxa 271010805 woy ai lerw alu noizogon sat ro boas (EI
86
47
Standard
Error
P-
value
Upper
95%
t Stat
Lower 95%
Coefficients
12185.3
Intercept
Trend
nielexa 212.4
68.4
57.4 uoy o0.0nol 11758.0dhid 12612.6
53.5
7.4
9.2
0.0
83.3
b) What is your forecast of US Exports to Mexico for March 2005 (which would be the 50
observations)?
3160
Expert Solution
This question has been solved!
Explore an expertly crafted, step-by-step solution for a thorough understanding of key concepts.

Step by stepSolved in 3 steps with 2 images

Knowledge Booster

Similar questions
- I have this much done, but need help with E, i,ii,iii Which asks: Choose a year other than the one from part 2c. A birth year or the first year might be a good choice(I picked 1990) .i. Use the trend line equation to estimate the y-value for the year of your choice. Find the relative change in the y-value for your chosen year compared to the last year’s value you found in part 2c iii. Interpret the meaning of your relative change value. F.Should we use the trend line model to estimate the y-value for 2020? Why or why not? Note: Hey there! Thank you for the question. As you have posted multiple sub-parts, we have helped you solve the first three parts, according to our policy. Please re-post the other parts with complete background information. Step 2 Calculation: As it is required to build a scatterplot with a trendline, we need to use Excel, where this feature is available. The independent or predictor variable is year, which we have denoted as x, and the dependent…arrow_forwardSuppose your firm generated $50.0million$50.0million in sales. What would be the 95%95% prediction interval for your firm's net income? Write your answer using interval notation. Round your answer to 1 decimal place.arrow_forwardSuppose a firm has had the following historic sales figures. Year: 2016 2017 2018 2019 2020 Sales $2,570,000 $3,750,000 $4,380,000 $5,010,000 $5,520,000 What would be the forecast for next year’s sales using regression to estimate a trend?arrow_forward
- Do the plots show any trend? If yes, is the trend,Why or why not?arrow_forwardSuppose the following estimated regression equation was determined to predict salary based on years of experience. Estimated Salary = 29,136.63 +2257.51(Years of Experience) What is the estimated salary for an employee with 24 years of experience? Answer Keypad Keyboard Shortcuts Tablesarrow_forwardPlease help me. Thankyou.arrow_forward
arrow_back_ios
arrow_forward_ios
Recommended textbooks for you
- MATLAB: An Introduction with ApplicationsStatisticsISBN:9781119256830Author:Amos GilatPublisher:John Wiley & Sons Inc
 Probability and Statistics for Engineering and th...StatisticsISBN:9781305251809Author:Jay L. DevorePublisher:Cengage Learning
 Statistics for The Behavioral Sciences (MindTap C...StatisticsISBN:9781305504912Author:Frederick J Gravetter, Larry B. WallnauPublisher:Cengage Learning
  Elementary Statistics: Picturing the World (7th E...StatisticsISBN:9780134683416Author:Ron Larson, Betsy FarberPublisher:PEARSON
 The Basic Practice of StatisticsStatisticsISBN:9781319042578Author:David S. Moore, William I. Notz, Michael A. FlignerPublisher:W. H. Freeman
 Introduction to the Practice of StatisticsStatisticsISBN:9781319013387Author:David S. Moore, George P. McCabe, Bruce A. CraigPublisher:W. H. Freeman
MATLAB: An Introduction with Applications
Statistics
ISBN:9781119256830
Author:Amos Gilat
Publisher:John Wiley & Sons Inc
Probability and Statistics for Engineering and th...
Statistics
ISBN:9781305251809
Author:Jay L. Devore
Publisher:Cengage Learning
Statistics for The Behavioral Sciences (MindTap C...
Statistics
ISBN:9781305504912
Author:Frederick J Gravetter, Larry B. Wallnau
Publisher:Cengage Learning
Elementary Statistics: Picturing the World (7th E...
Statistics
ISBN:9780134683416
Author:Ron Larson, Betsy Farber
Publisher:PEARSON
The Basic Practice of Statistics
Statistics
ISBN:9781319042578
Author:David S. Moore, William I. Notz, Michael A. Fligner
Publisher:W. H. Freeman
Introduction to the Practice of Statistics
Statistics
ISBN:9781319013387
Author:David S. Moore, George P. McCabe, Bruce A. Craig
Publisher:W. H. Freeman