ENGR.ECONOMIC ANALYSIS
14th Edition
ISBN: 9780190931919
Author: NEWNAN
Publisher: Oxford University Press
expand_more
expand_more
format_list_bulleted
Question

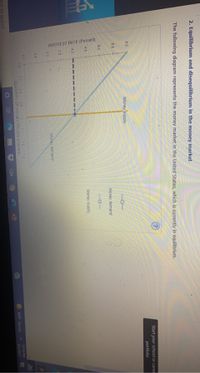
Transcribed Image Text:INTEREST RATE (Percent)
2. Equilibrium and disequilibrium in the money market
The following diagram represents the money market in the United'States, which is currently in equilibrium.
Start your school or caree
portfolio
6.0
Money supply
5.5
Money demand
5.0
4.5
es of
Money supply
4.0
3.5
3.0
Money demand
25
10
1.1
12
1.3
QUANTITY OF MONEY (Trillions of dollars)
1216 PM
84°F Sunny
8120021
ere to search

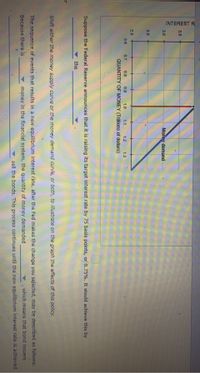
Transcribed Image Text:INTEREST R
3.5
3.0
Money demand
2.5
2.0
0.6
0.7
0.8
0.9
1.0
1.1
1.2
1.3
QUANTITY OF MONEY (Trillions of dollars)
Suppose the Federal Reserve announces that it is raising its target interest rate by 75 basis points, or 0.75%. It would achieve this by
the
Shift either the money supply curve or the money demand curve, or both, to illustrate on the graph the effects of this policy.
The sequence of events that results in a new equilibrium interest rate, after the Fed makes the change you selected, may be described as follows:
Because there is
money in the financial system, the quantity of money demanded
which means that bond issuers
sell the bonds. This process continues until the new equilibrium interest rate is achieved.
Expert Solution
This question has been solved!
Explore an expertly crafted, step-by-step solution for a thorough understanding of key concepts.
This is a popular solution
Trending nowThis is a popular solution!
Step by stepSolved in 2 steps with 1 images

Knowledge Booster
Learn more about
Need a deep-dive on the concept behind this application? Look no further. Learn more about this topic, economics and related others by exploring similar questions and additional content below.Similar questions
- Sylvia, a writer for a newspaper, interviewed top managers at 50 large corporations. All of the managers indicated that the primary determinant of planned investment is the interest rate and not their expected sales. In addition they all told her that their desired investment function is very flat. From this information, if Sylvia is a good macroeconomist, she would conclude that Group of answer choices neither expansionary nor contractionary monetary policy would be very effective. both expansionary and contractionary monetary policy would be very effective. fiscal policy would be very effective, but monetary policy would not be very effective. fiscal policy would not be very effective, but monetary policy would be very effective.arrow_forwardSuppose that money demand is given by M = $Y(0.30-i) where $Y is $200 and i denotes the interest rate in decimal form. Also, suppose that the supply of money is $25. Calculate the equilibrium interest rate as a percent. The equilibrium interest rate is %. (Round your response to two decimal places.) If the Federal Reserve wants to increase the interest rate by 10 percentage points (0.1 in decimal form) over and above the equilibrium interest rate determined above, at what level should it set the money supply? The money supply should be set at $ (Round your response to one decimal place.)arrow_forwardSuppose the Fed announces that it is raising its target interest rate by 25 basis points, or 0.25 percentage point. To do this, the Fed will use open-market operations to the money by the public. Use the green line (triangle symbol) on the previous graph to illustrate the effects of this policy by placing the new money supply curve (MS) in the correct location. Place the black point (plus symbol) at the new equilibrium interest rate and quantity of money. Suppose the following graph shows the aggregate demand curve for this economy. The Fed's policy of targeting a higher interest rate will the cost of borrowing, causing residential and business investment spending to and the quantity of output demanded to at each price level. Note:- Do not provide handwritten solution. Maintain accuracy and quality in your answer. Take care of plagiarism. Answer completely. You will get up vote for sure.arrow_forward
- 6. Changes in the money supply The following graph represents the money market for some hypothetical economy. This economy is similar to the United States in the sense that it has a central bank called the Fed, but a major difference is that this economy is closed (and therefore does not have any interaction with other world economies). The money market is currently in equilibrium at an interest rate of 3.5% and a quantity of money equal to $0.4 trillion, designated on the graph by the grey star symbol. INTEREST RATE (Percent) 5.5 5.0 New MS Curve Money Demand 4.5 4.0 3.5 3.0 2.5 2.0 1.5 0 0.1 0.2 Money Supply 0.3 0.4 0.5 0.6 0.7 0.8 MONEY (Trillions of dollars) New Equilibrium (?) Suppose the Fed announces that it is raising its target interest rate by 50 basis points, or 0.5 percentage points. To do this, the Fed will use open- market operations to the money by the public. Use the green line (triangle symbol) on the previous graph to illustrate the effects of this policy by placing…arrow_forward2. The theory of liquidity preference and the downward-slopingaggregate demand curve The following graph shows the money market in a hypothetical economy. The central bank in this economy is called the Fed. Assume that the Fed fixes the quantity of money supplied. Suppose the price level decreases from 90 to 75. Shift the appropriate curve on the graph to show the impact of a decrease in the overall price level on the market for money. 12 Money Supply 10 Money Demand Money Supply MD1 2 MD2 10 20 30 40 50 60 MONEY (Billions of dollars) INTEREST RATE (Percent)arrow_forward5. Changes in the money supply The following graph represents the money market in a hypothetical economy. As in the United States, this economy has a central bank called the Fed, but unlike in the United States, the economy is closed (that is, the economy does not interact with other economies in the world). The money market is currently in equilibrium at an interest rate of 6% and a quantity of money equal to $0.4 trillion, as indicated by the grey star. INTEREST RATE (Percent) 8.0 7.5 7.0 6.5 6.0 5.5 5.0 4.5 4.0 0 Money Demand + 0.1 Money Supply 0.2 0.3 0.4 0.5 MONEY (Trillions of dollars) 0.6 0.7 0.8 New MS Curve New Equilibrium ?arrow_forward
- please fill in the blanks and finish the graph: The following graph represents the money market for some hypothetical economy. This economy is similar to the United States in the sense that it has a central bank called the Fed, but a major difference is that this economy is closed (and therefore does not have any interaction with other world economies). The money market is currently in equilibrium at an interest rate of 2.5% and a quantity of money equal to $0.4 trillion, designated on the graph by the grey symbol.Suppose the Fed announces that it is lowering its target interest rate by 75 basis points, or 0.75 percentage points. To do this, the Fed will use open market operations to the money by the public. Use the green line (triangle symbol) on the previous graph to illustrate the effects of this policy by placing the new money supply curve (MS) in the correct location. Place the black point (plus symbol) at the new equilibrium interest rate and quantity of money. Use the green line…arrow_forwardScenario 2 Suppose the money demand is given by MdYx (0.4 - i) = where i is the interest rate. Suppose income Y totals 250. 9. Refer to Scenario 2. If the money supply is M³ = 25, what is the equilibrium interest rate? 10. Refer to Scenario 2. Suppose the Federal Reserve just met and decided they would like to decrease the interest rate by 4 percentage points (compared to the equilibrium rate you found in the previous question). What kind of monetary policy should it use, and what would the money supply have to equal to achieve that goal? (Your answer should be two items: first is expansion or contraction, the second is the actual amount the money supply should be.)arrow_forwardSuppose the Federal Reserve (the US central bank) increases the money stock. Create a graph that explains the effect of the Fed's expansionary monetary policy in the Long Run.arrow_forward
- Suppose the Federal Reserve (the US central bank) increases the money stock. Which of the following statements describes the effect of monetary expansion on real GDP and the price level in the Short Run? A) The price level will increase, and real GDP will remain at its natural level. B) The price level will increase, and real GDP will increase above its natural level. C) The price level will decrease, and real GDP will remain at its natural level. D) The price level will decrease, and real GDP will decrease below its natural level.arrow_forwardChanges in the money supply The following graph represents the money market for some hypothetical economy. This economy is similar to the United States in the sense that it ha a central bank called the Fed, but a major difference is that this economy is closed (and therefore does not have any interaction with other world economies). The money market is currently in equilibrium at an interest rate of 4% and a quantity of money equal to $0.4 trillion, designated on the graph by the grey star symbol. INTEREST RATE (Percent) 6.0 5.5 5.0 45 4.0 35 3.0 25 20 0 Money Demand 0.1 Money Supply 0.2 03 0.4 0.5 0.6 0.7 MONEY (Trillions of dollars) 08 4 New MS Curve New Equilibrium Ⓒ image 1 Suppose the Fed announces that it is lowering its target interest rate by 75 basis points, or 0.75 percentage points. To do this, the Fed will use open- market operations to the money by the public. Use the green line (triangle symbol) on the previous graph to illustrate the effects of this policy by placing the…arrow_forwardSuppose that money demand is given by the function MD=55+P, and the Bank of Canada maintains the supply of money at MS=$58b. If the Bank of Canada suddenly increases the money supply to MS'-$60b, what has happened to equilibrium value of money? a)It has decreased from 5 to 2 b)MD will shift, and the value of money will remain unchanged c)It has increased from 3 to 5 d) It has decreased from 1/3 to 1/5arrow_forward
arrow_back_ios
SEE MORE QUESTIONS
arrow_forward_ios
Recommended textbooks for you

 Principles of Economics (12th Edition)EconomicsISBN:9780134078779Author:Karl E. Case, Ray C. Fair, Sharon E. OsterPublisher:PEARSON
 Engineering Economy (17th Edition)EconomicsISBN:9780134870069Author:William G. Sullivan, Elin M. Wicks, C. Patrick KoellingPublisher:PEARSON
 Principles of Economics (MindTap Course List)EconomicsISBN:9781305585126Author:N. Gregory MankiwPublisher:Cengage Learning
 Managerial Economics: A Problem Solving ApproachEconomicsISBN:9781337106665Author:Luke M. Froeb, Brian T. McCann, Michael R. Ward, Mike ShorPublisher:Cengage Learning
 Managerial Economics & Business Strategy (Mcgraw-...EconomicsISBN:9781259290619Author:Michael Baye, Jeff PrincePublisher:McGraw-Hill Education


Principles of Economics (12th Edition)
Economics
ISBN:9780134078779
Author:Karl E. Case, Ray C. Fair, Sharon E. Oster
Publisher:PEARSON

Engineering Economy (17th Edition)
Economics
ISBN:9780134870069
Author:William G. Sullivan, Elin M. Wicks, C. Patrick Koelling
Publisher:PEARSON

Principles of Economics (MindTap Course List)
Economics
ISBN:9781305585126
Author:N. Gregory Mankiw
Publisher:Cengage Learning

Managerial Economics: A Problem Solving Approach
Economics
ISBN:9781337106665
Author:Luke M. Froeb, Brian T. McCann, Michael R. Ward, Mike Shor
Publisher:Cengage Learning

Managerial Economics & Business Strategy (Mcgraw-...
Economics
ISBN:9781259290619
Author:Michael Baye, Jeff Prince
Publisher:McGraw-Hill Education