
Practical Management Science
6th Edition
ISBN: 9781337406659
Author: WINSTON, Wayne L.
Publisher: Cengage,
expand_more
expand_more
format_list_bulleted
Related questions
Question
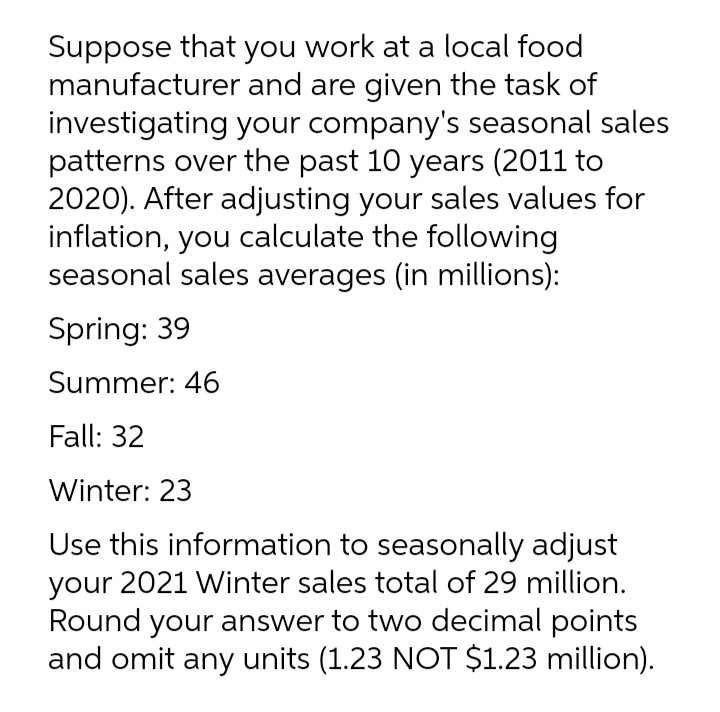

Transcribed Image Text:Suppose that you work at a local food
manufacturer and are given the task of
investigating your company's seasonal sales
patterns over the past 10 years (2011 to
2020). After adjusting your sales values for
inflation, you calculate the following
seasonal sales averages (in millions):
Spring: 39
Summer: 46
Fall: 32
Winter: 23
Use this information to seasonally adjust
your 2021 Winter sales total of 29 million.
Round your answer to two decimal points
and omit any units (1.23 NOT $1.23 million).
Expert Solution
This question has been solved!
Explore an expertly crafted, step-by-step solution for a thorough understanding of key concepts.

This is a popular solution

Trending nowThis is a popular solution!

Step by stepSolved in 2 steps with 3 images

Knowledge Booster

Similar questions
- A random sample of 10,000 customers was selected over a six month period. The data provides information on their current status with the bank as well as 12 additional attributes describing their demographic and banking information. what are the key predictors the bank should be aware of with their customers? Examples are included, but not limited to:Are female customers leaving more than males? Is there indication of customer departures associated with specific countries?Is there evidence of salary associated departures? what is an appropiate marketing strategy to attract and retain long term customersarrow_forwardA firm's short-term forecast helps top management in preparing a company budget. True or False True False < Prev 10 of 10 Next 27 28 tv Sarrow_forward. Suppose that you are working as an analyst. Your task is to value company XYZ based on financial data available for this company. Discuss how you would go about doing this using themultiple growth rate Gordon growth model. Critically evaluate your approach by discussing any assumptions you make (about forecasts, discount rate etc.). What data is needed to value XYZ?arrow_forward
- In the given problem, what other probability distributions might accurately describe Oakdale’s weekly usage of glue?arrow_forwardSh8arrow_forwardSales over the past 10 years are shown below. Using the method of least squares, calculate the values of a and b to complete this regression equation. Year Sales 1 1,640 2 1,850 3 1,240 4 1,250 5 1,980 6 1,400 7 1,060 8 1,430 9 1,050 10 1,990 (Indicate a negative answer using a "-" sign. Do not round intermediate calculations and round your answer to 3 decimal places.) What is your forecast for next year's sales? (Do not round intermediate calculations and round your answer to 2 decimal places.)arrow_forward
- Urgently needarrow_forwardSenior executives at an oil company are trying to decide whether to drill for oil in a particular field. It costs the company $750,000 to drill. The company estimates that if oil is found the estimated value will be $3,650,000. At present, the company believes that there is a 48% chance that the field actually contains oil. Before drilling, the company can hire an expert at a cost of $75,000 to perform tests to make a prediction of whether oil is present. Based on a similar test, the probability that the test will predict oil on the field is 0.55. The probability of actually finding oil when oil was predicted is 0.85. The probability of actually finding oil when no oil was predicted is 0.2. What is the EMV if the company hires the expert?arrow_forwardGiven the following data, use least-squares regression to derive a trend equation: Period Demand where y Demand and x = Period. 1 10 2 12 3 5 4 13 5 12 6 11 D The least-squares regression equation that shows the best relationship between demand and period is (round your responses to two decimal places):arrow_forward
- Hi, I need help with solving for the following values (boxed). Thank you.arrow_forwardA careful analysis of the cost of operating an automobile was conducted by accounting manager Dia Bandaly. The following model was developed: y = 3,600+ 0.16x, where y is the annual cost and x is the miles driven. a) If the car is driven 15,000 miles this year, the forecasted cost of operating this automobile = $ b) If the car is driven 26,000 miles this year, the forecasted cost of operating this automobile = $ (enter your response as a whole number). (enter your response as a whole number).arrow_forwardPlease answer question attached in the image belowarrow_forward
arrow_back_ios
SEE MORE QUESTIONS
arrow_forward_ios
Recommended textbooks for you
- Practical Management ScienceOperations ManagementISBN:9781337406659Author:WINSTON, Wayne L.Publisher:Cengage,
 Operations ManagementOperations ManagementISBN:9781259667473Author:William J StevensonPublisher:McGraw-Hill Education
 Operations and Supply Chain Management (Mcgraw-hi...Operations ManagementISBN:9781259666100Author:F. Robert Jacobs, Richard B ChasePublisher:McGraw-Hill Education
 Purchasing and Supply Chain ManagementOperations ManagementISBN:9781285869681Author:Robert M. Monczka, Robert B. Handfield, Larry C. Giunipero, James L. PattersonPublisher:Cengage Learning
 Production and Operations Analysis, Seventh Editi...Operations ManagementISBN:9781478623069Author:Steven Nahmias, Tava Lennon OlsenPublisher:Waveland Press, Inc.
Practical Management Science
Operations Management
ISBN:9781337406659
Author:WINSTON, Wayne L.
Publisher:Cengage,
Operations Management
Operations Management
ISBN:9781259667473
Author:William J Stevenson
Publisher:McGraw-Hill Education
Operations and Supply Chain Management (Mcgraw-hi...
Operations Management
ISBN:9781259666100
Author:F. Robert Jacobs, Richard B Chase
Publisher:McGraw-Hill Education
Purchasing and Supply Chain Management
Operations Management
ISBN:9781285869681
Author:Robert M. Monczka, Robert B. Handfield, Larry C. Giunipero, James L. Patterson
Publisher:Cengage Learning
Production and Operations Analysis, Seventh Editi...
Operations Management
ISBN:9781478623069
Author:Steven Nahmias, Tava Lennon Olsen
Publisher:Waveland Press, Inc.