
MATLAB: An Introduction with Applications
6th Edition
ISBN: 9781119256830
Author: Amos Gilat
Publisher: John Wiley & Sons Inc
expand_more
expand_more
format_list_bulleted
Related questions
Question
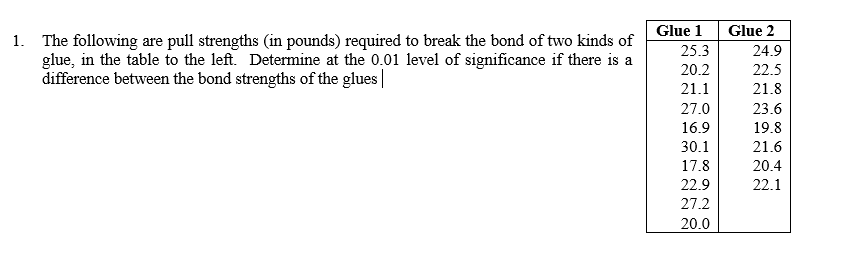

Transcribed Image Text:1. The following are pull strengths (in pounds) required to break the bond of two kinds of
glue, in the table to the left. Determine at the 0.01 level of significance if there is a
difference between the bond strengths of the glues |
Glue 1
25.3
20.2
21.1
27.0
16.9
30.1
17.8
22.9
27.2
20.0
Glue 2
24.9
22.5
21.8
23.6
19.8
21.6
20.4
22.1

Transcribed Image Text:State hypothesis
Define test, one or 2 sided?
Test assumptions (equal variance, normality)
State test statistic (t, F, Chi-square)
State critical value (1 or 2 sided, degrees of freedom) example: f crit (1, 3, 20)
State conclusions.
You can use Excel or STATA as an aid to perform the tests, but you should be "in control" of all the steps. If
applicable, include STATA outputs, or Excel spreadsheets, in your submission.
Expert Solution
This question has been solved!
Explore an expertly crafted, step-by-step solution for a thorough understanding of key concepts.

This is a popular solution

Trending nowThis is a popular solution!

Step by stepSolved in 5 steps with 2 images

Knowledge Booster

Similar questions
- Hocument/d/1ho6gSyZTqOTIUok211PsszM1fL7Jz4K2HPR4WWL4x1g/edit sert Format Tools Extensions Help 2 100% D 1 ▼ Normal text 2 1 W L #3 E 2 $ Arial A quality control expert at Glotech computers wants to test their new monitors. The production manager claims they have a mean life of 83 months with a variance of 100. If the claim is true, what is the probability that the mean monitor life would be greater than 81.3 months in a sample of 89 monitors? Round your answer to four decimal places. R % 5 T ^ 10.5 + 6 Y & B 7 * CO I U 5 8 I A ( 9 ) 0 6 Parrow_forwardAssume the samples are random and independent, the populations are nomally distributed, and the population variances are equal. The table available below shows the prices (in dollars) for a sample of automobile batteries. The prices are classified according to battery type. At a = 0.10, is there enough evidence conclude that at least one mean battery price is different from the others? Complete parts (a) through (e) below. E Click the icon to view the battery cost data. (a) Let u1. P2. H3 represent the mean prices for the group size 35, 65, and 24/24F respectively. Identify the claim and state Ho and H. H Cost of batteries by type The claim is the V hypothesis. Group size 35 Group size 65 Group size 24/24F 101 111 121 124 D 146 173 182 278 124 140 141 89 (b) Find the critical value, Fo, and identify the rejection region. 90 79 84 The rejection region is F Fo, where Fo = (Round to two decimal places as needed.) (c) Find the test statistic F. Print Done F= (Round to two decimal places as…arrow_forwardTwo-sample t-test I need to perform a two-sample t-test analysis to determine if mean absenteeism is different between organizations which have a good Union management and those that do not. Can you please explain the steps to get this in excel? Data: Wage Pct PT Pct U Av Shift U/M Rel Absent 22477 8.5 57.1 1 1 5.4 29939 1.9 41.5 0 1 4.1 22957 12.2 52.6 1 0 11.5 18888 30.8 65.1 0 1 2.1 15078 6.8 68.8 0 1 5.9 15481 5.1 46.4 0 0 12.9 21481 25.3 38.9 0 1 3.5 29687 9.2 17.2 0 0 2.6 13603 8.4 12.9 0 0 8.6 18303 4.9 18.1 0 1 2.7 20832 23.8 64.4 1 1 6.6 22325 24.1 63.7 1 1 2.1 19964 8.6 12.2 0 1 3.8 32496 5.9 11.8 1 0 4.3 15795 2.9 25.8 0 1 4.3 21138 24.3 53.2 0 0 2.2 18859 20.6 22.8 1 1 8.6 12023 9 49.8 1 1 10.8 33272 24 39.1 1 0 2.9 22325 11.9 32.6 1 0 5.3 26147 0 67.7 1 0 8.2 33229 11.7 10.8 0 0 2.8 37970 14.6 25.5 1 1 2.4 15281 27.2 31.8 0 0 2.8 19423 17.2 35 1 1 5 26587 13.9 41.9 1 1 9.5 22963 2.6 52.9 0 1 4.3 26404 6.4 64.4 0 1…arrow_forward
- Data of variable-A is collected as shown to the right. Is the mean of Variable-A less than 80? State null hypothesis and choose level of significance, a = 0.05. (Use Excel ttest function, provide clear logic and reasoning.) Variable-A Variable-B 78.8 81.9 76.9 78.0 67.8 69.7 68.9 74.7 70.5 70.0 80.0 68.2 63.0 88.7 78.7 86.7 85.4 69.5 87.0 75.1 82.4 71.8 78.2 58.1 76.9 74.8 60.2 93.2 82.6 84.6 67.2 66.5 71.7 77.2 68.9 74.0 69.3 77.7 89.1 78.6 76.3 68.3 74.0 89.0 69.4 82.1 76.3 78.0 66.2 80.3 73.9 82.4 79.1 83.1 80.4 66.4 66.2 67.6 80.9 75.3arrow_forwardTextbook: Statistics for the Behavioral SciencesGregory J. Privitera Please show your work-Concept and Application Problems (Pg.133) If Sample 1 has a variance of 4 and Sample 2 has variance of 32, can we tell which sample had a larger range? If so, which sample had a greater range?arrow_forwardI have no idea how to do this, any and all help is very much appreciatedarrow_forward
- Statistics students in Oxnard College sampled 10 textbooks in the Condor bookstore and recorded the number of pages in each textbook and its cost. The bivariate data is shown below, Number of Pages (x) 445 304 721 666 383 794 706 745 904 916 Cost(y) 75.85 61.52 108.73 99.58 71.79 119.22 108.78 112.85 141.52 138.08 Click to Copy-and-Paste Data A student calculates a linear model y = to two decimal places) X + (Please show your answers Use the model above to estimate the cost when number of pages is 503 Cost = $ places.) (Please show your answer to 2 decimalarrow_forwardPlease answer all of themarrow_forwardA,b,carrow_forward
arrow_back_ios
arrow_forward_ios
Recommended textbooks for you
- MATLAB: An Introduction with ApplicationsStatisticsISBN:9781119256830Author:Amos GilatPublisher:John Wiley & Sons Inc
 Probability and Statistics for Engineering and th...StatisticsISBN:9781305251809Author:Jay L. DevorePublisher:Cengage Learning
 Statistics for The Behavioral Sciences (MindTap C...StatisticsISBN:9781305504912Author:Frederick J Gravetter, Larry B. WallnauPublisher:Cengage Learning
  Elementary Statistics: Picturing the World (7th E...StatisticsISBN:9780134683416Author:Ron Larson, Betsy FarberPublisher:PEARSON
 The Basic Practice of StatisticsStatisticsISBN:9781319042578Author:David S. Moore, William I. Notz, Michael A. FlignerPublisher:W. H. Freeman
 Introduction to the Practice of StatisticsStatisticsISBN:9781319013387Author:David S. Moore, George P. McCabe, Bruce A. CraigPublisher:W. H. Freeman
MATLAB: An Introduction with Applications
Statistics
ISBN:9781119256830
Author:Amos Gilat
Publisher:John Wiley & Sons Inc
Probability and Statistics for Engineering and th...
Statistics
ISBN:9781305251809
Author:Jay L. Devore
Publisher:Cengage Learning
Statistics for The Behavioral Sciences (MindTap C...
Statistics
ISBN:9781305504912
Author:Frederick J Gravetter, Larry B. Wallnau
Publisher:Cengage Learning
Elementary Statistics: Picturing the World (7th E...
Statistics
ISBN:9780134683416
Author:Ron Larson, Betsy Farber
Publisher:PEARSON
The Basic Practice of Statistics
Statistics
ISBN:9781319042578
Author:David S. Moore, William I. Notz, Michael A. Fligner
Publisher:W. H. Freeman
Introduction to the Practice of Statistics
Statistics
ISBN:9781319013387
Author:David S. Moore, George P. McCabe, Bruce A. Craig
Publisher:W. H. Freeman