
MATLAB: An Introduction with Applications
6th Edition
ISBN: 9781119256830
Author: Amos Gilat
Publisher: John Wiley & Sons Inc
expand_more
expand_more
format_list_bulleted
Related questions
Topic Video
Question
thumb_up100%
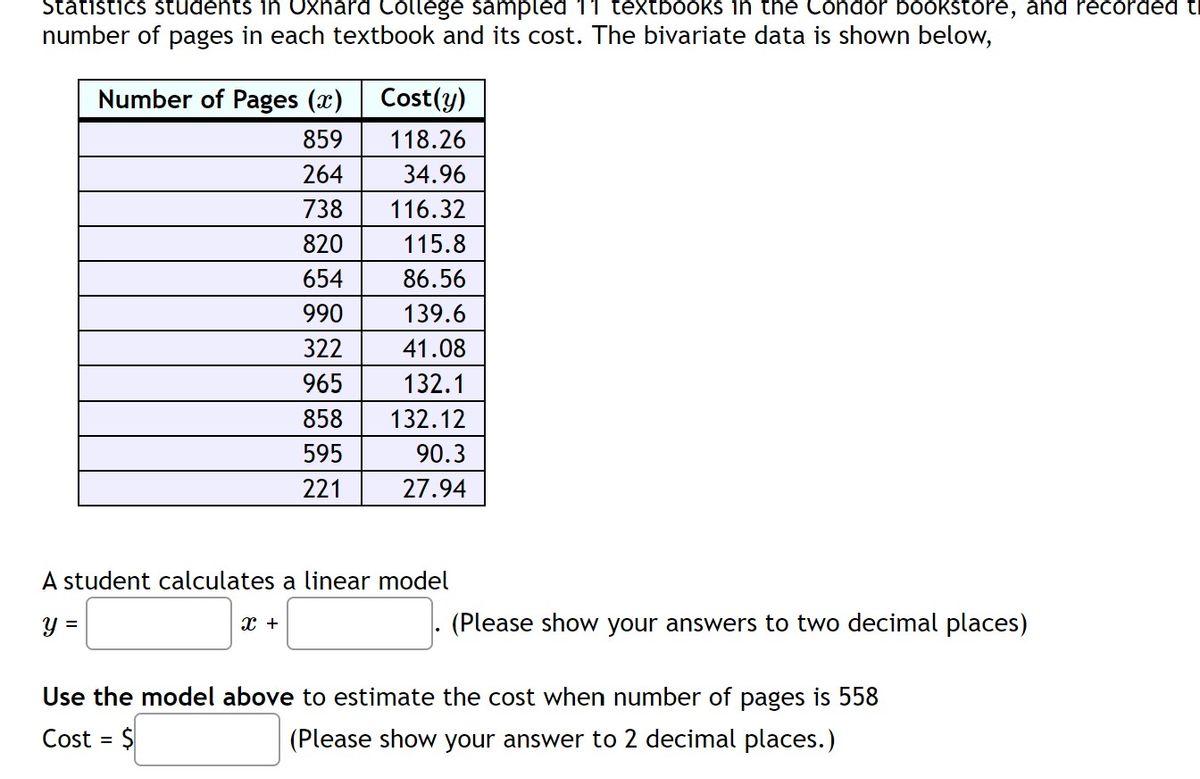

Transcribed Image Text:Statistics students in Oxnard College sampled 11 textbooks in the Condor bookstore, and recorded ti
number of pages in each textbook and its cost. The bivariate data is shown below,
Number of Pages (x)
Cost(y)
859
118.26
264
34.96
738
116.32
820
115.8
654
86.56
990
139.6
322
41.08
965
132.1
858
132.12
595
90.3
221
27.94
A student calculates a linear model
y =
x +
(Please show your answers to two decimal places)
Use the model above to estimate the cost when number of pages is 558
Cost = $
(Please show your answer to 2 decimal places.)
Expert Solution
This question has been solved!
Explore an expertly crafted, step-by-step solution for a thorough understanding of key concepts.

This is a popular solution

Trending nowThis is a popular solution!

Step by stepSolved in 2 steps with 1 images

Knowledge Booster


Learn more about
Need a deep-dive on the concept behind this application? Look no further. Learn more about this topic, statistics and related others by exploring similar questions and additional content below.Similar questions
- In which of these research designs would you have complete control of the environment? Cohort Cross-sectional Experimental Case-Controlarrow_forwardThe Insurance Institute for Highway Safety publishes data on the total damage suffered by compact automobiles in a series of controlled, low-speed collisions. The cost for a sample of 9 cars, in hundreds of dollars, is provided below. 10, 6, 8, 10, 5, 3.5, 7.5, 7,9.5 Find interquartile range for mileage data and value of variance.arrow_forwardAn analysis of variances produces dftotal = 16 and dfwithin = 14. For this analysis, how many treatment conditions are being compared?arrow_forward
- Hi, I'm stuck with question 2. Question 1 given the example for this questionarrow_forwardplease don't provide hand writtin solution....arrow_forwardIndividual actions can play a large role in the overall health of our planet. A researcher interested in evaluating environment friendly behaviors evaluated how often people recycle (per month) based on whether they have an overall optimistic or an overall pessimistic attitude toward eco-friendly behaviors. The results from this hypothetical study are given in the table. Test whether or not recycling behaviors differed between groups using a .05 level of significance. State the value of the test statistics and the decision to retain or reject the null hypothesis. Compute effect size using eta- squared (n^2). Pessimistic Optimistic 3 4 0 9 4 6 2 8 1 9 6 5 3 6 5 8 0 6 5 7arrow_forward
- On a particular proposal of national importance, males and females cast votes as included in the following table In Favor Opposed Undecided Male 90 65 43 Female 115 74 32 Suggest an appropriate test for the data and analyze it at 1% level of significance.arrow_forwardIndicate which of the following are measures of spread. (a)Inter quartile range (b)Mean (c)Range (d)Variancearrow_forwardChoose the appropriate statistical test. When computing, be sure to round each answer as indicated. A dentist wonders if depression affects ratings of tooth pain. In the general population, using a scale of 1-10 with higher values indicating more pain, the average pain rating for patients with toothaches is 6.8. A sample of 30 patients that show high levels of depression have an average pain rating of 7.1 (variance 0.8). What should the dentist determine? 1. Calculate the estimated standard error. (round to 3 decimals). [st.error] 2. What is thet-obtained? (round to 3 decimals). 3. What is the t-cv? (exact value) 4. What is your conclusion? Only type "Reject" or Retain"arrow_forward
- In a study performed on comfort food eating during times of stress, it was found that mean rated comfort food consumption level (on a scale from 1-20) for a group of students undertaking their exam period was 14. In comparison, a group of students who were not undertaking exams or examination preparation had a mean rated comfort food consumption level of 10. The pooled estimate of the population variance was 64. What is the estimated effect size (d) of the study? 0.80 0.06 0.50 2.00arrow_forwardThe article cited in Exercise 19 provides measures of electrical conductivity (in uS/cm). The results are presented in the following table. Sample Size 49 Location Mean SD Upstream 463 208 Midstream 363 98 31 Downstream 647 878 30 Can a one-way analysis of variance be used to determine whether conductivity varies with location? Or is one of the necessary assumptions violated? Explain.arrow_forward
arrow_back_ios
arrow_forward_ios
Recommended textbooks for you
- MATLAB: An Introduction with ApplicationsStatisticsISBN:9781119256830Author:Amos GilatPublisher:John Wiley & Sons Inc
 Probability and Statistics for Engineering and th...StatisticsISBN:9781305251809Author:Jay L. DevorePublisher:Cengage Learning
 Statistics for The Behavioral Sciences (MindTap C...StatisticsISBN:9781305504912Author:Frederick J Gravetter, Larry B. WallnauPublisher:Cengage Learning
  Elementary Statistics: Picturing the World (7th E...StatisticsISBN:9780134683416Author:Ron Larson, Betsy FarberPublisher:PEARSON
 The Basic Practice of StatisticsStatisticsISBN:9781319042578Author:David S. Moore, William I. Notz, Michael A. FlignerPublisher:W. H. Freeman
 Introduction to the Practice of StatisticsStatisticsISBN:9781319013387Author:David S. Moore, George P. McCabe, Bruce A. CraigPublisher:W. H. Freeman
MATLAB: An Introduction with Applications
Statistics
ISBN:9781119256830
Author:Amos Gilat
Publisher:John Wiley & Sons Inc
Probability and Statistics for Engineering and th...
Statistics
ISBN:9781305251809
Author:Jay L. Devore
Publisher:Cengage Learning
Statistics for The Behavioral Sciences (MindTap C...
Statistics
ISBN:9781305504912
Author:Frederick J Gravetter, Larry B. Wallnau
Publisher:Cengage Learning
Elementary Statistics: Picturing the World (7th E...
Statistics
ISBN:9780134683416
Author:Ron Larson, Betsy Farber
Publisher:PEARSON
The Basic Practice of Statistics
Statistics
ISBN:9781319042578
Author:David S. Moore, William I. Notz, Michael A. Fligner
Publisher:W. H. Freeman
Introduction to the Practice of Statistics
Statistics
ISBN:9781319013387
Author:David S. Moore, George P. McCabe, Bruce A. Craig
Publisher:W. H. Freeman