
MATLAB: An Introduction with Applications
6th Edition
ISBN: 9781119256830
Author: Amos Gilat
Publisher: John Wiley & Sons Inc
expand_more
expand_more
format_list_bulleted
Related questions
Question
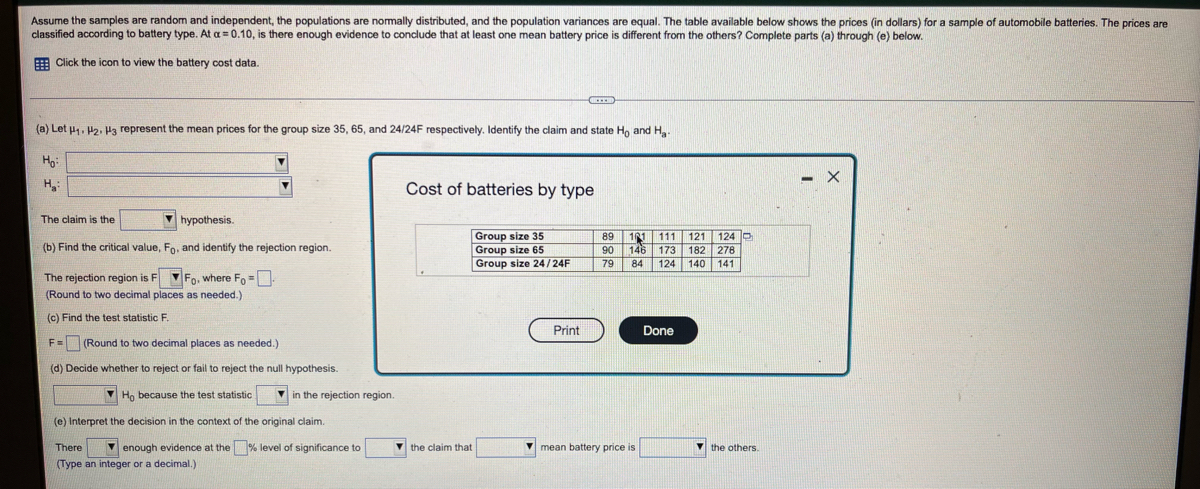

Transcribed Image Text:Assume the samples are random and independent, the populations are nomally distributed, and the population variances are equal. The table available below shows the prices (in dollars) for a sample of automobile batteries. The prices are
classified according to battery type. At a = 0.10, is there enough evidence
conclude that at least one mean battery price is different from the others? Complete parts (a) through (e) below.
E Click the icon to view the battery cost data.
(a) Let u1. P2. H3 represent the mean prices for the group size 35, 65, and 24/24F respectively. Identify the claim and state Ho and H.
H
Cost of batteries by type
The claim is the
V hypothesis.
Group size 35
Group size 65
Group size 24/24F
101 111 121 124 D
146 173 182 278
124 140 141
89
(b) Find the critical value, Fo, and identify the rejection region.
90
79
84
The rejection region is F Fo, where Fo =
(Round to two decimal places as needed.)
(c) Find the test statistic F.
Print
Done
F= (Round to two decimal places as needed.)
(d) Decide whether to reject or fail to reject the null hypothesis.
Ho because the test statistic
V in the rejection region.
(e) Interpret the decision in the context of the original claim.
There
V enough evidence at the % level of significance to
V the claim that
V mean battery price is
(Type an integer or a decimal.)
Expert Solution
This question has been solved!
Explore an expertly crafted, step-by-step solution for a thorough understanding of key concepts.

This is a popular solution

Trending nowThis is a popular solution!

Step by stepSolved in 2 steps with 2 images

Knowledge Booster

Similar questions
- 2. The speeds (in km/hr) of 14 roller coasters found around the world are given below. Find the median. upper and lower quartiles, the maximum and minimum, then make a box plot to display the data. 149, 85, 85, 120, 128, 107, 85, 104, 105.6, 104, 95, 93, 92, 90 Min: Q1: Median: Q3: Max:arrow_forwardIdentify the type of data that would be used to describe a response. Number of Mt. SAC students selected to go on a UCLA college campus tour. Qualitative Quantitative - Discrete O Quantitative - Continuousarrow_forwardThe data show the distance (in miles) from an airport of a sample of 22 inbound and outbound airplanes. Use technology to answer parts (a) and (b). a. Find the data set's first, second, and third quartiles. b. Draw a box-and-whisker plot that represents the data set. 5.3 3.7 5.3 2.4 4.7 4.9 5.4 3.1 3.3 3.8 4.1 2.9 2.8 4.6 4.3 5.9 2.2 3.7 4.7 4.3 2.6 3.4arrow_forward
- Please do in steps.arrow_forwardIndicate the level of measurement for the data set described. Number of siblings that students in your statistics class have Ordinal Nominal Interval Ratioarrow_forwardState whether the data described below are discrete or continuous, and explain why. The exact distances (in centimeters) between the chairs in a college classroomarrow_forward
- The data show the distance (in miles) from an airport of a sample of 22 inbound and outbound airplanes. Use technology to answer parts (a) and (b). a. Find the data set's first, second, and third quartiles. b. Draw a box-and-whisker plot that represents the data set. 5.2 4.1 2.6 5.8 4.9 5.4 4.1 2.5 5.2 5.5 2.3 2.2 2.6 1.9 3.1 4.5 5.2 5.9 4.9 4.6 2.4 3.4 a. Find the three quartiles. Q₁ = Q₂ = Q3 (Type integers or decimals. Do not round.) ||arrow_forwardQuestion #1 pleasearrow_forwardCreate a histogram for each of your variables using the same classes that you used for your frequency table. Discuss the distribution of each histogram. Based on the shape of each histogram, would the mean or median be a better measure of center for each variable? Explain.The graphs go up by 2.5. male stats: mean-18.1667 standard deviation-2.7796 N-183 female stats: mean-20.8973 standard deviation-3.3859 N-183arrow_forward
- State whether the quantity described is a parameter or a statistic and give the correct notation.Average number of television sets per household in North Carolina, using data from a sample of 1100 households.arrow_forwardWhat is the FSTAT and P-Value?arrow_forwardIf a data set has 15 mean standard daviation 2 , percentage observation lie between 13 and 17arrow_forward
arrow_back_ios
SEE MORE QUESTIONS
arrow_forward_ios
Recommended textbooks for you
- MATLAB: An Introduction with ApplicationsStatisticsISBN:9781119256830Author:Amos GilatPublisher:John Wiley & Sons Inc
 Probability and Statistics for Engineering and th...StatisticsISBN:9781305251809Author:Jay L. DevorePublisher:Cengage Learning
 Statistics for The Behavioral Sciences (MindTap C...StatisticsISBN:9781305504912Author:Frederick J Gravetter, Larry B. WallnauPublisher:Cengage Learning
  Elementary Statistics: Picturing the World (7th E...StatisticsISBN:9780134683416Author:Ron Larson, Betsy FarberPublisher:PEARSON
 The Basic Practice of StatisticsStatisticsISBN:9781319042578Author:David S. Moore, William I. Notz, Michael A. FlignerPublisher:W. H. Freeman
 Introduction to the Practice of StatisticsStatisticsISBN:9781319013387Author:David S. Moore, George P. McCabe, Bruce A. CraigPublisher:W. H. Freeman
MATLAB: An Introduction with Applications
Statistics
ISBN:9781119256830
Author:Amos Gilat
Publisher:John Wiley & Sons Inc
Probability and Statistics for Engineering and th...
Statistics
ISBN:9781305251809
Author:Jay L. Devore
Publisher:Cengage Learning
Statistics for The Behavioral Sciences (MindTap C...
Statistics
ISBN:9781305504912
Author:Frederick J Gravetter, Larry B. Wallnau
Publisher:Cengage Learning
Elementary Statistics: Picturing the World (7th E...
Statistics
ISBN:9780134683416
Author:Ron Larson, Betsy Farber
Publisher:PEARSON
The Basic Practice of Statistics
Statistics
ISBN:9781319042578
Author:David S. Moore, William I. Notz, Michael A. Fligner
Publisher:W. H. Freeman
Introduction to the Practice of Statistics
Statistics
ISBN:9781319013387
Author:David S. Moore, George P. McCabe, Bruce A. Craig
Publisher:W. H. Freeman