Survey of Accounting (Accounting I)
8th Edition
ISBN: 9781305961883
Author: Carl Warren
Publisher: Cengage Learning
expand_more
expand_more
format_list_bulleted
Question
Please help to solve all of question 1

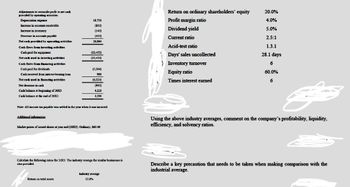
Transcribed Image Text:Return on ordinary shareholders' equity
20.0%
18,750
Profit margin ratio
4.0%
(850)
Dividend yield
5.0%
Current ratio
Acid-test ratio
Days' sales uncollected
) Inventory turnover
Equity ratio
Times interest earned
2.5:1
1.3.1
28.1 days
6
60.0%
6
Adjustments to reconcile profit to net cash
provided by operating activities:
Depreciation expense
Increase in accounts receivable
Increase in inventory
(140)
Decrease in accounts payable
(420)
Net cash provided by operating activities
26,064
Cash flows from investing activities
Cash paid for equipment
(22,470)
Net cash used in investing activities
(22,470)
Cash flows from financing activities
Cash paid for dividends
(5,504)
Cash received from interest-bearing loan
980
Net cash used in financing activities
(4,524)
Net decrease in cash
(930)
Cash balance at beginning of 20x3
4,220
3,290
Cash balance at the end of 20X3
Note: All income tax payable was settled in the year when it was incurred.
Additional information
Market prices of issued shares at year end (20×3): Ordinary. $60.00
Using the above industry averages, comment on the company's profitability, liquidity,
efficiency, and solvency ratios.
Calculate the following ratios for 2003. The industry average for similar businesses is
also provided.
Describe a key precaution that needs to be taken when making comparison with the
industrial average.
Return on total assets
Industry average
12.0%

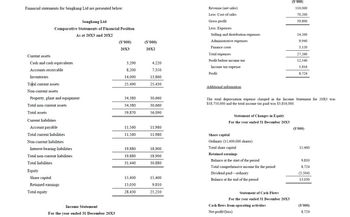
Transcribed Image Text:Financial statements for Sengkang Ltd are presented below:
Sengkang Ltd
Comparative Statements of Financial Position
As at 20X3 and 20X2
Revenue (net sales)
Less: Cost of sales
Gross profit
($'000)
110,000
70,200
39,800
Less: Expenses
Selling and distribution expenses
14,200
(S'000)
($'000)
20X3
20X2
Administrative expenses
9,940
Finance costs
3,120
Total expenses
27,260
Profit before income tax
12,540
3,290
4,220
Income tax expense
3,816
8,200
7,350
Profit
8,724
14,000
13,860
25,490
25,430
Current assets
Cash and cash equivalents
Accounts receivable
Inventories
Total current assets
Non-current assets
Property, plant and equipment
34,380
30,660
Total non-current assets
34,380
30,660
Total assets
59,870
56,090
Current liabilities
Additional information
The total depreciation expense charged in the Income Statement for 20X3 was
$18,750,000 and the total income tax paid was $3,816,000.
Statement of Changes in Equity
For the year ended 31 December 20X3
Account payable
11,560
11,980
($'000)
Total current liabilities
11,560
11,980
Share capital
Non-current liabilities
Ordinary (15,400,000 shares)
Interest-bearing liabilities
19,880
18,900
Total share capital
15,400
Total non-current liabilities
19.880
18,900
Retained earnings
Total liabilities
Balance at the start of the period
9.810
31,440
30,880
Total comprehensive income for the period
8.724
Equity
Dividend paid - ordinary
(5.504)
Share capital
15,400
15,400
Balance at the end of the period
13,030
Retained earnings
13,030
9,810
Total equity
28,430
25,210
Statement of Cash Flows
Income Statement
For the year ended 31 December 20X3
For the year ended 31 December 20X3
Cash flows from operating activities
($'000)
Net profit/(loss)
8,724
Expert Solution
This question has been solved!
Explore an expertly crafted, step-by-step solution for a thorough understanding of key concepts.
Step by stepSolved in 2 steps

Knowledge Booster
Similar questions
- Which company stock is better to invest and whyarrow_forwardSalesOperating costs (excluding depreciation and amortization) EBITDADepreciation and amortization Earnings before interest and taxes Interest Earnings before taxesTaxes (40%)Net income available to common stockholders Common dividendsSEBRINGCORPORATION: BALANCESHEETSFORYEARENDINGDECEMBER31 (FIGURES ARE STATED IN MILLIONS) Assets: Cash and marketable securities Accounts receivableInventories Total current assets Gross Fixed Assets Less DepreciationNet plant and equipment Total assets 2005 2004 $3,600.0 $3,000.0 $3,060.0 $2,550.0 $540.0 $450.0 90.0 75.0 $450.0 $375.0 65.0 60.0 $385.0 $315.0 154.0 126.0 $231.0 $189.0 $15.0 $13.0 2005 2004 $ 36.00 $ 30.00 $ 340.00 $ 250.00 $ 457.00 $ 351.00 $ 833.00 $ 631.00 $ 1,065.00 $ 825.00 $ (165.00) $ (75.00) $ 900.00 $ 750.00 $ 1,733.00 $ 1,381.00 $ 324.00 $ 270.00 $ 201.00 $ 155.00 $ 216.00 $ 180.00 $ 741.00 $ 605.00 $ 450.00 $ 450.00 $ 1,191.00 $ 1,055.00 $ 150.00 $ 150.00 $ 392.00 $ 176.00 $ 542.00 $ 326.00 $ 1,733.00 $ 1,381.00…arrow_forwardSolar Solutions began operations on January 1, 2015, and is now in its sixth year of operations. It is a retail sales company with a large amount of online sales. The adjusted trial balance as of December 31, 2020 appears below, along with prior year balance sheet data and some additional transaction data for 2020. SOLAR SOLUTIONS Adjusted Trial Balance 12/31/2020 2020 2019 Account Title Adjusted Trial Balance Post-Closing Trial Balance $ 125,600 Debit Credit 35,000 6,000 Debit Credit Cash Accounts Receivable Prepaid Insurance Inventory Office Equipment Machinery & Tools |Accumulated Depreciation Accounts Payable Salaries Payable Sales Tax Payable Note Payable-Long Term Common Stock, $10 par Retained Earnings $ 122,200 125,600 55,000 35,000 15,600 5,000 6,000 47,000 46,000 15,600 21,000 63,000 47,000 (16,000) $ 234,200 59,000 21,000 21,000 16,000 11,200 16,800 2,600 2,700 2,000 31,000 4,000 22,100 240,000 160,000 28,600 28,600 Dividends 10,000 Sales Revenue 235,000 Cost of Goods Sold…arrow_forward
- calculate: Debt ratio Interest coverage ratio Dividend yield current asset- 1.170.7 million inventory- 859.9 million currant liability- 885.8 million total dedt- 1.598.8 million total assets- 2.452.3 million operating profit- 1.230.5 million interest expense- 10,700 thousandarrow_forwardNeed help ASAP :(arrow_forwardI want to correct answer general accounting questionarrow_forward
- Financial accountingarrow_forwardTotal debt to total assets% ratio: ?? Round your answer to the nearest hundredth percent Return on equity% ratio: ?? Round your answer to the nearest hundredth percent Asset turnover ratio: ?? Round your answer to the nearest centarrow_forwardGeneral accounting questionarrow_forward
arrow_back_ios
SEE MORE QUESTIONS
arrow_forward_ios
Recommended textbooks for you
 Survey of Accounting (Accounting I)AccountingISBN:9781305961883Author:Carl WarrenPublisher:Cengage Learning
 Intermediate Financial Management (MindTap Course...FinanceISBN:9781337395083Author:Eugene F. Brigham, Phillip R. DavesPublisher:Cengage Learning
 Financial Accounting: The Impact on Decision Make...AccountingISBN:9781305654174Author:Gary A. Porter, Curtis L. NortonPublisher:Cengage Learning
 Intermediate Accounting: Reporting And AnalysisAccountingISBN:9781337788281Author:James M. Wahlen, Jefferson P. Jones, Donald PagachPublisher:Cengage Learning
 Financial Reporting, Financial Statement Analysis...FinanceISBN:9781285190907Author:James M. Wahlen, Stephen P. Baginski, Mark BradshawPublisher:Cengage Learning
 College Accounting, Chapters 1-27AccountingISBN:9781337794756Author:HEINTZ, James A.Publisher:Cengage Learning,

Survey of Accounting (Accounting I)
Accounting
ISBN:9781305961883
Author:Carl Warren
Publisher:Cengage Learning

Intermediate Financial Management (MindTap Course...
Finance
ISBN:9781337395083
Author:Eugene F. Brigham, Phillip R. Daves
Publisher:Cengage Learning

Financial Accounting: The Impact on Decision Make...
Accounting
ISBN:9781305654174
Author:Gary A. Porter, Curtis L. Norton
Publisher:Cengage Learning

Intermediate Accounting: Reporting And Analysis
Accounting
ISBN:9781337788281
Author:James M. Wahlen, Jefferson P. Jones, Donald Pagach
Publisher:Cengage Learning

Financial Reporting, Financial Statement Analysis...
Finance
ISBN:9781285190907
Author:James M. Wahlen, Stephen P. Baginski, Mark Bradshaw
Publisher:Cengage Learning

College Accounting, Chapters 1-27
Accounting
ISBN:9781337794756
Author:HEINTZ, James A.
Publisher:Cengage Learning,