FINANCIAL ACCOUNTING
10th Edition
ISBN: 9781259964947
Author: Libby
Publisher: MCG
expand_more
expand_more
format_list_bulleted
Question
Required: Compute the following for Year 2:
- Earnings per share of common stock
- Price-earnings ratio
- Dividend payout ratio
- Dividend yield ratio
- Return on total assets
- Return on common
stockholders' equity - Book value per share
Working capital Current ratio - Acid-test (quick) ratio
Accounts receivable turnover- Average collection period (age of receivables)
- Inventory turnover
- Average sale period (turnover in days)
- Times interest earned
- Debt-to-equity ratio

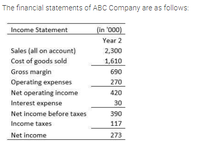
Transcribed Image Text:The financial statements of ABC Company are as follows:
Income Statement
(in '000)
Year 2
Sales (all on account)
2,300
Cost of goods sold
1,610
Gross margin
690
Operating expenses
270
Net operating income
420
Interest expense
30
Net income before taxes
390
Income taxes
117
Net income
273

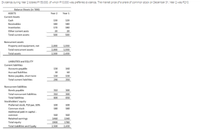
Transcribed Image Text:Dividends during Year 2 totaled P153,000, of wnich P10,000 was preferred dividends. The market price of a snare of common stock on December 31, Year 2 was P210.
Balance Sheets (in '000)
ASSETS
Year 2
Year 1
Current Assets
Cash
130
120
Receivables
180
180
Inventories
170
180
Other current assts
20
500
20
Total current assets
500
Noncurrent assets
Property and equipment, net
2,000
1,930
Total noncurrent assets
2,000
1,930
Total assets
2,500
2,430
LIABILITIES and EQUITY
Current liabilities
Accounts payable
130
160
Accrued liabilities
30
60
Notes payable, short term
130
130
Total current liabilities
290
350
Noncurrent liabilities
Bonds payable
Total noncurrent liabilities
310
300
310
300
Total liabilities
600
650
Stockholders' equity
Preferred stock, P10 par, 10%
100
100
Common stock
180
180
Additional paid-in capital -
common
160
160
Retained earnings
1460
1340
Total equity
1900
1780
Total Liabilities and Equity
2,500
2,430
Expert Solution
This question has been solved!
Explore an expertly crafted, step-by-step solution for a thorough understanding of key concepts.
Step by stepSolved in 2 steps with 1 images

Knowledge Booster
Learn more about
Need a deep-dive on the concept behind this application? Look no further. Learn more about this topic, accounting and related others by exploring similar questions and additional content below.Similar questions
- Use the information provided from Sapphire Ltd calculate and comment on the following ratios:1. Profit margin2. Return on equityarrow_forwardCurrent Position Analysis The following data were taken from the balance sheet of Albertini Company at the end of two recent fiscal years: Previous Year Current assets: Cash Marketable securities Accounts and notes receivable (net) Inventories Prepaid expenses. Total current assets. Current liabilities: Accounts and notes payable (short-term) Accrued liabilities Total current liabilities 1. Working capital 2. Current ratio: Current Year 3. Quick ratio b. The liquidity of Albertini has $356,400 412,700 168,900 1,547,700 797,300 $3,283,000 $388,600 281,400 $670,000 $278,400 313,200 104,400 1,167,500 746,500 $2,610,000 a. Determine for each year (1) the working capital, (2) the current ratio, and (3) the quick ratio. Round ratios to one decimal place. Current Year Previous Year $406,000 174,000 $580,000 from the preceding year to the current year. The working capital, current ratio, and quick ratio have all in current assets relative to current liabilities. Most of these changes are the…arrow_forwardPlease correct answer and don't use hand ratingarrow_forward
- use the following information to make a Common size income statementarrow_forwardConsider this simplified balance sheet for Geomorph Trading: Current assets Long-term assets $ 245 Current liabilities Long-term debt 630 Other liabilities Equity $ 875 Required: a. What is the company's debt-equity ratio? (Hint: debt = Current liabilities, Long-term debt, and Other liabilities) Note: Round your answer to 2 decimal places. b. What is the ratio of total long-term debt to total long-term capital? Note: Round your answer to 2 decimal places. c. What is its net working capital? d. What is its current ratio? Note: Round your answer to 2 decimal places. $ 170 215 140 350 $ 875 a Debt-equity ratio b. Long-term debt-to-capital ratio c. Net working capital d. Current ratioarrow_forwardCurrent Position Analysis The following data were taken from the balance sheet of Nilo Company at the end of two recent fiscal years: Current Year Previous Year Current assets: Cash Marketable securities Accounts and notes receivable (net) Inventories Prepaid expenses Total current assets Current liabilities: Accounts and notes payable (short-term) Accrued liabilities Total current liabilities a. Determine for each year (1) the working Current Year 1. Working capital 2. Current ratio 3. Quick ratio b. The liquidity of Nilo has current assets relative to current liabilities. $690,500 799,500 327,000 1,042,800 537,200. $3,397,000 $458,200 $579,600 652,100 217,300 673,400 430,600 $2,553,000 $483,000 331,800 207,000 $790,000 $690,000 capital, (2) the current ratio, and (3) the quick ratio. Round ratios to one decimal place. Previous Year from the preceding year to the current year. The working capital, current ratio, and quick ratio have all . Most of these changes are the result of an inarrow_forward
- Current Position Analysis The following data were taken from the balance sheet of Nilo Company at the end of two recent fiscal years: Current Year Previous Year Current assets: Cash Marketable securities Accounts and notes receivable (net) Inventories Prepaid expenses Total current assets Current liabilities: Accounts and notes payable (short-term) Accrued liabilities Total current liabilities $387,600 448,800 183,600 1,032,200 531,800 $2,584,000 1. Working capital 2. Current ratio 3. Quick ratio b. The liquidity of Nilo has improved increased $394,400 285,600 $680,000 $306,800 345,200 115,000 719,800 460,200 $1,947,000 $413,000 177,000 $590,000 a. Determine for each year (1) the working capital, (2) the current ratio, and (3) the quick ratio. Round ratios to one decimal place. Current Year Previous Year ✔ from the preceding year to the current year. The working capital, current ratio, and quick ratio have all ✔Most of these channes are the result of an increase ✔in nurrent accets…arrow_forwardMatch the following ratio functions with the ratio (place the number of your chosen answer into the box with the border beside the term you think it goes with : Dividend Yield Debt ratio Current Ratio Price/Earnings Ratio Acid-test ratio Earnings per share 1. The amount of net income earned for each share of the company's common stock 2. The percentage of a stock's market value returned to stockholders as dividends each period 3. The ability to pay current liabilities with current assets. 4. The percentage of assets financed with debt. 5. The ability to pay all current liabilities if they come due immediately. 6. The market price of $1 of earnings.arrow_forwardPlease solve for PART A (liquidity’s current ratio, account receivables turnover, and inventory turnover/profitability’s profit margin, asset turnover, return on assets, and earnings per share) and PART B (return on common stockholder’s equity, debt to assets ratio, and price earnings ratio)arrow_forward
- 2. Calculate the projected inventory turnover, days sales outstanding (DSO), fixed assets turnover, and total assets turnover. How does Abiproffy's utilization of assets stack up against other firms in its industry? Calculate the projected current and quick ratios based on the projected balance sheet and income statement data. What can you say about the company's liquidity position and its trend? Calculate the projected debt ratio, the debt-to-equity ratio, liabilities-to-assets ratio, earnings multiplier, times-interest-earned, and EBITDA coverage ratios. How does Abiproffy compare with the industry with respect to financial leverage? What can you conclude from these ratios? Calculate the projected price/earnings ratio and market/book ratio. Do these ratios indicate that investors are expected to have a high or low opinion of the company? It is commonly recommended that the managers of a firm compare the performance of their firm to that of its peers. Increasingly, this is becoming a…arrow_forwardRequired: Compute the following ratios for 2020: 1. Current Ratio 2. Quick Ratio 3. Receivable Turnover 4. Average Collection Period 5. Inventory Turnover 6. Average Sales Period 7. Working Capital 8. Debt Ratio 9. Equity Ratio 10. Debt to Equity Ratio 11. Time Interest Earned 12. Gross Profit Ratio 13. Operating Profit Margin 14. Net Profit Margin 15. Return on Assetsarrow_forwardMatch each ratio that follows to its use. Items may be used more than once.arrow_forward
arrow_back_ios
SEE MORE QUESTIONS
arrow_forward_ios
Recommended textbooks for you

 AccountingAccountingISBN:9781337272094Author:WARREN, Carl S., Reeve, James M., Duchac, Jonathan E.Publisher:Cengage Learning,
 Accounting Information SystemsAccountingISBN:9781337619202Author:Hall, James A.Publisher:Cengage Learning,
 Horngren's Cost Accounting: A Managerial Emphasis...AccountingISBN:9780134475585Author:Srikant M. Datar, Madhav V. RajanPublisher:PEARSON
 Intermediate AccountingAccountingISBN:9781259722660Author:J. David Spiceland, Mark W. Nelson, Wayne M ThomasPublisher:McGraw-Hill Education
 Financial and Managerial AccountingAccountingISBN:9781259726705Author:John J Wild, Ken W. Shaw, Barbara Chiappetta Fundamental Accounting PrinciplesPublisher:McGraw-Hill Education


Accounting
Accounting
ISBN:9781337272094
Author:WARREN, Carl S., Reeve, James M., Duchac, Jonathan E.
Publisher:Cengage Learning,

Accounting Information Systems
Accounting
ISBN:9781337619202
Author:Hall, James A.
Publisher:Cengage Learning,

Horngren's Cost Accounting: A Managerial Emphasis...
Accounting
ISBN:9780134475585
Author:Srikant M. Datar, Madhav V. Rajan
Publisher:PEARSON

Intermediate Accounting
Accounting
ISBN:9781259722660
Author:J. David Spiceland, Mark W. Nelson, Wayne M Thomas
Publisher:McGraw-Hill Education

Financial and Managerial Accounting
Accounting
ISBN:9781259726705
Author:John J Wild, Ken W. Shaw, Barbara Chiappetta Fundamental Accounting Principles
Publisher:McGraw-Hill Education