
FINANCIAL ACCOUNTING
10th Edition
ISBN: 9781259964947
Author: Libby
Publisher: MCG
expand_more
expand_more
format_list_bulleted
Related questions
Question
The following are Blossom Corp.’s comparative
|
COMPARATIVE BALANCE SHEETS
|
|||||||||
|---|---|---|---|---|---|---|---|---|---|
|
2020
|
2019
|
Increase
(Decrease) |
|||||||
|
Cash
|
$814,600
|
$706,000
|
$108,600
|
||||||
|
|
1,129,100
|
1,176,600
|
(47,500
|
)
|
|||||
|
Inventory
|
1,861,900
|
1,719,500
|
142,400
|
||||||
|
Property, plant, and equipment
|
3,335,800
|
2,940,300
|
395,500
|
||||||
|
|
(1,159,600)
|
(1,046,100)
|
(113,500)
|
||||||
|
Investment in Myers Co.
|
313,100
|
277,300
|
35,800
|
||||||
|
Loan receivable
|
249,200
|
—
|
249,200
|
||||||
|
Total assets
|
$6,544,100
|
$5,773,600
|
$770,500
|
||||||
|
|
|||||||||
|
Accounts payable
|
$1,013,700
|
$946,000
|
$67,700
|
||||||
|
Income taxes payable
|
29,900
|
50,000
|
(20,100
|
)
|
|||||
|
Dividends payable
|
80,200
|
99,800
|
(19,600
|
)
|
|||||
|
Lease liabililty
|
455,900
|
—
|
455,900
|
||||||
|
Common stock, $1 par
|
500,000
|
500,000
|
—
|
||||||
|
Paid-in capital in excess of par—common stock
|
1,502,100
|
1,502,100
|
—
|
||||||
|
|
2,962,300
|
2,675,700
|
286,600
|
||||||
|
Total liabilities and
|
$6,544,100
|
$5,773,600
|
$770,500
|
Additional information:
| 1. | On December 31, 2019, Blossom acquired 25% of Myers Co.’s common stock for $277,300. On that date, the carrying value of Myers’s assets and liabilities, which approximated their fair values, was $1,109,200. Myers reported income of $143,200 for the year ended December 31, 2020. No dividend was paid on Myers’s common stock during the year. | |
| 2. | During 2020, Blossom loaned $355,300 to TLC Co., an unrelated company. TLC made the first semiannual principal repayment of $106,100, plus interest at 10%, on December 31, 2020. | |
| 3. | On January 2, 2020, Blossom sold equipment costing $60,400, with a carrying amount of $38,000, for $40,200 cash. | |
| 4. | On December 31, 2020, Blossom entered into a capital lease for an office building. The present value of the annual rental payments is $455,900, which equals the fair value of the building. Blossom made the first rental payment of $60,200 when due on January 2, 2021. | |
| 5. | Net income for 2020 was $366,800. | |
| 6. | Blossom declared and paid the following cash dividends for 2020 and 2019. |
|
2020
|
2019
|
|||
|---|---|---|---|---|
|
Declared
|
December 15, 2020 | December 15, 2019 | ||
|
Paid
|
February 28, 2021 | February 28, 2020 | ||
|
Amount
|
$80,200 | $99,800 |
Prepare a statement of
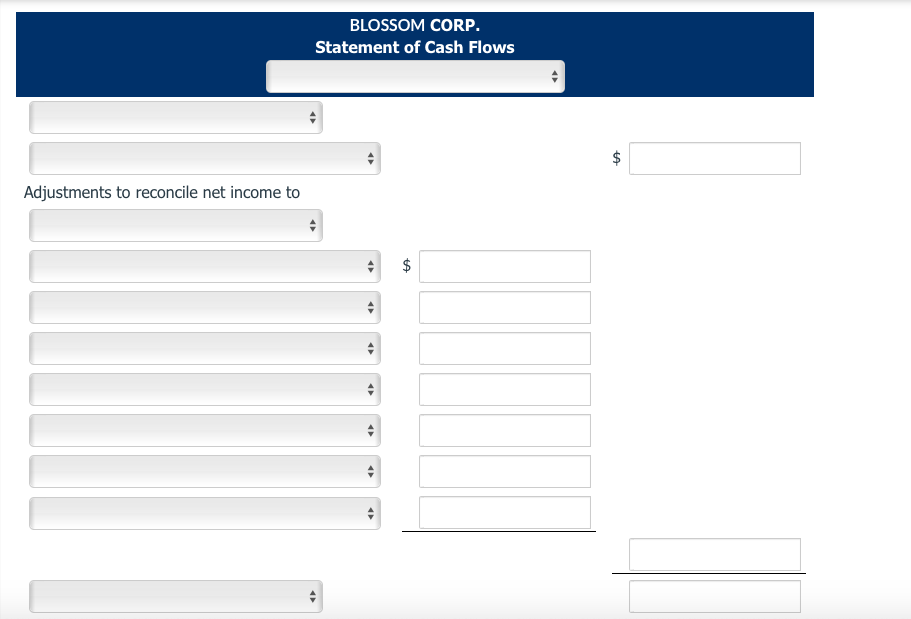

Transcribed Image Text:**BLOSSOM CORP. Statement of Cash Flows**
_Header Section:_
- Dropdown selection for specific details or categories.
- Empty space for entering dollar amounts.
_Main Section:_
- **Adjustments to reconcile net income to:**
- Multiple dropdown options for selecting adjustments.
- Corresponding empty fields for entering dollar amounts.
_Total:_
- Calculation area with lines for total amounts.
This structure is designed for inputting and calculating components of a cash flow statement, beginning with net income and adjustments. Dropdowns likely contain specific financial terms or categories, and fields allow for numerical entry, necessary for final cash flow calculations.

Transcribed Image Text:The image displays a form with several dropdown menus and input fields, likely designed for configuring specific financial or product parameters. Below is a detailed description suitable for an educational context:
### Dropdown Menus
The form includes a series of dropdown menus, each indicated by a small arrow, suggesting user interaction is required to select options from a predefined list. The dropdown fields might be used to choose categories or specific items related to financial products or other configurable settings.
### Input Fields
The form also includes various input fields, allowing text entry. These fields might be used for specific numerical or textual data input, such as:
1. **Top Left Section:**
- Sequential dropdown fields for selecting options.
2. **Top Right Section:**
- Three input fields possibly for entering identifiers or quantities.
- One standalone input field for an unspecified purpose.
3. **Middle Right Section:**
- Two input fields aligned vertically.
- Three additional input fields, with one being marked by a dollar sign, indicating a monetary value.
4. **Bottom Section:**
- A single input field marked with a dollar sign, also intended for entering a financial figure.
### Educational Insight
In an educational context, this form could be a practical example for demonstrating how to build interactive web tools for data entry. It highlights the combination of dropdowns for selecting from predefined choices and text boxes for specific input, commonly seen in online financial tools, surveys, and configuration systems.
Expert Solution
This question has been solved!
Explore an expertly crafted, step-by-step solution for a thorough understanding of key concepts.

This is a popular solution

Trending nowThis is a popular solution!

Step by stepSolved in 3 steps with 7 images

Knowledge Booster


Learn more about
Need a deep-dive on the concept behind this application? Look no further. Learn more about this topic, accounting and related others by exploring similar questions and additional content below.Similar questions
- Common-Size Balance Sheets Consider the following balance sheet data for Davis Co., Inc., an electronics and major appliance retailer, at February 26, 2019 and February 27, 2018 (amounts in thousands): Feb. 26, 2019 Feb. 27, 2018 $60,872 $7,138 37,968 249,991 Cash and Cash Equivalents Accounts Receivables Merchandise Inventories Other Current Assets Total Current Assets Property and Equipment (net) Other Assets Total Assets Current Liabilities Long-Term liabilities Total Liabilities Common Stock Additional Paid-in-Capital Retained Earnings Total Stockholders' Equity Total Liabilities and Stockholders' Equity 52,944 637,950 13,844 765,610 172,724 15,160 $953,494 $402,028 239,022 641,050 3,087 224,089 85,268 312,444 $953,494 9,729 304,826 126,442 7,774 DAVIS CO.. INC. $439,042 $186,005 70,854 256,859 1,149 137,151 43,883 182,183 $439,042 Prepare common-size balance sheets for each year (use total assets as the base amount for computing percentages). Instructions: • Round percentages to…arrow_forwardThe balance sheet data of Flounder Company at the end of 2020 and 2019 are shown below. Cash Accounts receivable (net) Inventory Prepaid expenses Equipment Accumulated depreciation-equipment Land Accounts payable Accrued expenses Notes payable-bank, long-term Bonds payable Common stock, $10 par Retained earnings (a) (b) (c) Net Cash Net Cash 2020 $29,800 55,100 65,400 15,200 89,200 (17,840) 70,700 $307,560 Net Cash $65,500 15,100 -0- 30,000 188,100 8.860 $307,560 ✓by operating activities Land was acquired for $30,300 in exchange for common stock, par $30,300, during the year, all equipment purchased was for cash. Equipment costing $12.900 was sold for $3,000, book value of the equipment was $6,100 Cash dividends of $10,000 were declare and paid during the year. Compute net cash provided (used) by: (Show amounts that decrease cash flow with either a-sign eg-12.000 or in parenthesis es (12.00 V by investing activities 2019 $34,800 44,800 ✓by financing activities 45,100 25,100 74,200…arrow_forwardPlease do not provide answer in image format thank youarrow_forward
- Suppose these selected condensed data are taken from recent balance sheets of Bob Evans Farms (in thousands). 2020 2019 Cash $12,983 $8,308 Accounts receivable 22,433 18,683 Inventory 27,299 32,052 Other current assets 13,635 13,016 Total current assets $76,350 $72,059 Total current liabilities $254,500 $313,300 what is the current ratio for 2020 and 2019arrow_forwardThe comparative balance sheet for the ZYX Company on December 31, 2019 and 2018 is as follows: 12/31/19 12/31/18 Assets: Cash $146,600 $179,800 Accounts Receivable 224,600 242,000 Merchandise Inventory…arrow_forwardThe following are Grouper Corp.’s comparative balance sheet accounts at December 31, 2020 and 2019, with a column showing the increase (decrease) from 2019 to 2020. COMPARATIVE BALANCE SHEETS 2020 2019 Increase(Decrease) Cash $810,600 $701,400 $109,200 Accounts receivable 1,135,300 1,156,300 (21,000 ) Inventory 1,850,800 1,708,800 142,000 Property, plant, and equipment 3,318,800 2,955,300 363,500 Accumulated depreciation (1,164,400 ) (1,035,600 ) (128,800 ) Investment in Myers Co. 307,400 277,400 30,000 Loan receivable 248,800 — 248,800 Total assets $6,507,300 $5,763,600 $743,700 Accounts payable $1,015,700 $949,200 $66,500 Income taxes payable 30,200 50,000 (19,800 ) Dividends payable 79,500 100,400…arrow_forward
- The 2024 income statement of Adrian Express reports sales of $22,910,000, cost of goods sold of $13,150,000, and net income of $2,420,000. Balance sheet information is provided in the following table. Assets Current assets: Cash Accounts receivable Inventory ADRIAN EXPRESS Balance Sheets December 31, 2024 and 2023 Long-term assets Total assets Liabilities and Stockholders' Equity Current liabilities Long-term liabilities Common stock Retained earnings Total liabilities and stockholders' equity Industry averages for the following four risk ratios are as follows: Gross profit ratio Return on assets. Profit margin Asset turnover Return on equity 45% 25% 15% 19.5 35% times. 2024 2023 $1,060,000 $1,040,000 2,050,000 1,370,000 2,630,000 1,950,000 5,260,000 4,520,000 $11,000,000 $8,880,000 SUPERS $2,316,000 $1,976,000 2,724,000 2,716,000 2,350,000 2,170,000 3,610,000 2,018,000 $11,000,000 $8,880,000 Required: 1. Calculate the five profitability ratios listed above for Adrian Express. 2. Do…arrow_forwardThe 2021 income statement of Adrian Express reports sales of $15,960,000, cost of goods sold of $9,600,000, and net income of $1,600,000. Balance sheet information is provided in the following table. ADRIAN EXPRESS Balance Sheets December 31, 2021 and 2020 2021 2020 Assets Current assets: Cash Accounts receivable $ 600,000 $ 760,000 1,400,000 1,800,000 4,800,000 $8,600,000 1,000,000 1,400,000 4,240,000 $7,400,000 Inventory Long-term assets Total assets Liabilities and Stockholders' Equity Current liabilities $2,020,000 2,300,000 2,000,000 2,280,000 $8,600,000 $1,660,000 2,400,000 2,000,000 1,340,000 $7,400,000 Long-term liabilities Common stock Retained earnings Total liabilities and stockholders' equity Industry averages for the following four risk ratios are as follows: Average collection period Average days in inventory Current ratio 25 days 60 days 2 to 1 50% Debt to equity ratioarrow_forwardThe following are Grouper Corp.’s comparative balance sheet accounts at December 31, 2020 and 2019, with a column showing the increase (decrease) from 2019 to 2020. COMPARATIVE BALANCE SHEETS 2020 2019 Increase(Decrease) Cash $818,200 $696,600 $121,600 Accounts receivable 1,132,100 1,177,800 (45,700 ) Inventory 1,841,000 1,713,900 127,100 Property, plant, and equipment 3,334,900 2,970,400 364,500 Accumulated depreciation (1,157,500 ) (1,030,100 ) (127,400 ) Investment in Myers Co. 308,600 273,500 35,100 Loan receivable 249,300 — 249,300 Total assets $6,526,600 $5,802,100 $724,500 Accounts payable $1,007,200 $949,700 $57,500 Income taxes payable 30,200 50,300 (20,100 ) Dividends payable 80,000 99,900…arrow_forward
- The financial statements of Simon Co. include the following items (amounts in thousands): For the Year Ended December 31, 2020 $840 Income Statement Net income Depreciation and amortization expense 640 At December 31 Balance Sheets 2020 2019 Accounts receivable $250 $340 340 300 Inventory Accounts payable Income taxes payable 160 180 100 30 Required: a. Calculate the net cash flow provided by operations for Simon Co. for the year ended December 31, 2020. (Enter your answer in thousands. (i.e., 20,000 should be entered as 20)) Net cash provided (used) by operating activities b. Net income and cash flows provided by operations may differ because of the timing of cash receipts and payments versus the timing of recognition on the income statement. O True O Falsearrow_forwardPlease help mearrow_forwardJust Dew It Corporation reports the following balance sheet information for 2020 and 2021. JUST DEW IT CORPORATION 2020 and 2021 Balance Sheets Assets 2020 2021 Liabilities and Owners’ Equity 2020 2021 Current assets Current liabilities Cash $ 7,800 $ 12,250 Accounts payable $ 46,400 $ 52,750 Accounts receivable 15,800 31,000 Notes payable 20,600 26,500 Inventory 53,400 64,250 Total $ 77,000 $ 107,500 Total $ 67,000 $ 79,250 Long-term debt $ 46,000 $ 40,000 Owners’ equity Common stock and paid-in surplus $ 50,000 $ 50,000 Retained earnings 237,000 330,750 Net plant and equipment $ 323,000 $ 392,500 Total $ 287,000 $ 380,750 Total assets $ 400,000 $ 500,000 Total liabilities and owners’ equity $ 400,000 $ 500,000 For each account on this company’s balance sheet, show the change in the account during 2021 and note whether…arrow_forward
arrow_back_ios
SEE MORE QUESTIONS
arrow_forward_ios
Recommended textbooks for you
 AccountingAccountingISBN:9781337272094Author:WARREN, Carl S., Reeve, James M., Duchac, Jonathan E.Publisher:Cengage Learning,
 Accounting Information SystemsAccountingISBN:9781337619202Author:Hall, James A.Publisher:Cengage Learning,
 Horngren's Cost Accounting: A Managerial Emphasis...AccountingISBN:9780134475585Author:Srikant M. Datar, Madhav V. RajanPublisher:PEARSON
 Intermediate AccountingAccountingISBN:9781259722660Author:J. David Spiceland, Mark W. Nelson, Wayne M ThomasPublisher:McGraw-Hill Education
 Financial and Managerial AccountingAccountingISBN:9781259726705Author:John J Wild, Ken W. Shaw, Barbara Chiappetta Fundamental Accounting PrinciplesPublisher:McGraw-Hill Education
Accounting
Accounting
ISBN:9781337272094
Author:WARREN, Carl S., Reeve, James M., Duchac, Jonathan E.
Publisher:Cengage Learning,
Accounting Information Systems
Accounting
ISBN:9781337619202
Author:Hall, James A.
Publisher:Cengage Learning,
Horngren's Cost Accounting: A Managerial Emphasis...
Accounting
ISBN:9780134475585
Author:Srikant M. Datar, Madhav V. Rajan
Publisher:PEARSON
Intermediate Accounting
Accounting
ISBN:9781259722660
Author:J. David Spiceland, Mark W. Nelson, Wayne M Thomas
Publisher:McGraw-Hill Education
Financial and Managerial Accounting
Accounting
ISBN:9781259726705
Author:John J Wild, Ken W. Shaw, Barbara Chiappetta Fundamental Accounting Principles
Publisher:McGraw-Hill Education