Survey of Accounting (Accounting I)
8th Edition
ISBN: 9781305961883
Author: Carl Warren
Publisher: Cengage Learning
expand_more
expand_more
format_list_bulleted
Question

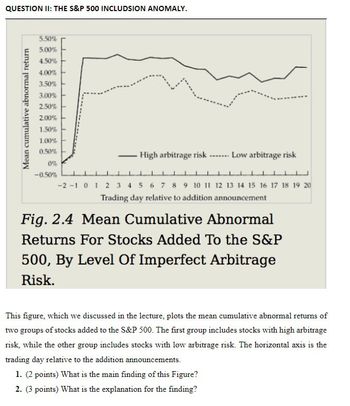
Transcribed Image Text:QUESTION II: THE S&P 500 INCLUDSION ANOMALY.
Mean cumulative abnormal return
5.50%
5.00%
4.50%
4.00%
3.50%
3.00%
2.50%
2.00%
1.50%
1.00%
0.50%
0%
-0.50%
High arbitrage risk ....... Low arbitrage risk
-2-1 0 123456789 10 11 12 13 14 15 16 17 18 19 20
Trading day relative to addition announcement
Fig. 2.4 Mean Cumulative Abnormal
Returns For Stocks Added To the S&P
500, By Level Of Imperfect Arbitrage
Risk.
This figure, which we discussed in the lecture, plots the mean cumulative abnormal returns of
two groups of stocks added to the S&P 500. The first group includes stocks with high arbitrage
risk, while the other group includes stocks with low arbitrage risk. The horizontal axis is the
trading day relative to the addition announcements.
1. (2 points) What is the main finding of this Figure?
2. (3 points) What is the explanation for the finding?
Expert Solution
This question has been solved!
Explore an expertly crafted, step-by-step solution for a thorough understanding of key concepts.
Step by stepSolved in 2 steps

Knowledge Booster
Similar questions
- Which asset in the following table has the most market risk (also known as systematic or non- diversifiable risk)? Asset A B Asset B Asset A Return Both Assets A and C Asset C (10% 12% 14% Beta 0.74 1.00 1.25 Standard Deviation 20% 40% 30%arrow_forwardCalculate the expected value of the scenario. X₁ P(x₁) -$0.25 0.1 $0 0.5 $0.25 0.1 $0.50 0.3arrow_forwardWhat is the expected return of a portfolio of two risky assets if the expected return E(Ri), standard deviation (SDi), covariance (COVij), and asset weight (Wi) are as shown below? Asset (A) E(R₂) = 25% SDA = 18% WA = 0.75 COVA, B = -0.0009 Select one: A. 13.65% B. 20 U ODN 20.0% C. 18.64% D. 22.5% Asset (B) E(R₂) = 15% SDB = 11% WB = 0.25arrow_forward
- Sh19 Please help me. Solutionarrow_forwardConsider the following two securities X and Y. Y Security Expected Return Standard Deviation Beta 12.5% 10.0% Risk-free asset 5.0% OA. 1.33 ○ B. 0.88 OC. 1.17 OD. 1.67 20.0% 1.5 30.0% 1.0arrow_forwardWhich asset in the following table has the most market risk (also known as systematic or non-diversifiable risk)? (Ch. 8) Asset Return Beta Standard Deviation Asset A 9% 0.95 20% Asset B 13% 1.10 35% Asset C 10% 1.00 40% Group of answer choices Asset A Asset C Asset B and Asset C Asset Barrow_forward
arrow_back_ios
SEE MORE QUESTIONS
arrow_forward_ios
Recommended textbooks for you
 Survey of Accounting (Accounting I)AccountingISBN:9781305961883Author:Carl WarrenPublisher:Cengage Learning

Survey of Accounting (Accounting I)
Accounting
ISBN:9781305961883
Author:Carl Warren
Publisher:Cengage Learning