Principles of Geotechnical Engineering (MindTap Course List)
9th Edition
ISBN: 9781305970939
Author: Braja M. Das, Khaled Sobhan
Publisher: Cengage Learning
expand_more
expand_more
format_list_bulleted
Question
I just need help with parts d and e, thanks!

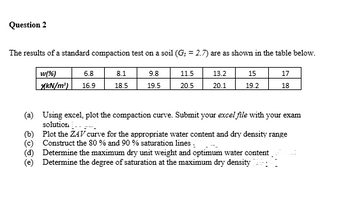
Transcribed Image Text:Question 2
The results of a standard compaction test on a soil (G; = 2.7) are as shown in the table below.
w(%)
xkN/m³) 16.9
6.8
8.1
9.8
11.5
13.2
15
17
18.5
19.5
20.5
20.1
19.2
18
(a) Using excel, plot the compaction curve. Submit your excel file with your exam
solution
(b) Plot the ZAV curve for the appropriate water content and dry density range
(c) Construct the 80 % and 90% saturation lines
(d) Determine the maximum dry unit weight and optimum water content
(e) Determine the degree of saturation at the maximum dry density
Expert Solution
This question has been solved!
Explore an expertly crafted, step-by-step solution for a thorough understanding of key concepts.
Step by stepSolved in 1 steps with 4 images

Knowledge Booster
Similar questions
- Repeat Problem 2.4 with the following data. 2.4 The following are the results of a sieve analysis. a. Determine the percent finer than each sieve and plot a grain-size distribution curve. b. Determine D10, D30, and D60 for each soil. c. Calculate the uniformity coefficient Cu. d. Calculate the coefficient of gradation Cc.arrow_forwardRepeat Problem 2.8 using the following data. 2.8 The following are the results of a sieve and hydrometer analysis. a. Draw the grain-size distribution curve. b. Determine the percentages of gravel, sand, silt and clay according to the MIT system. c. Repeat Part b according to the USDA system. d. Repeat Part b according to the AASHTO system.arrow_forwardRefer to Problem 2.C.1. Results of the sieve analysis for Soils A, B, and C are given below. To obtain a more representative sample for further geotechnical testing, a ternary blend is created by uniformly mixing 8000 kg of each soil. Answer the following questions. a. If a sieve analysis is conducted on the mixture using the same set of sieves as shown above, compute the mass retained (as a percentage) and cumulative percent passing in each sieve. b. What would be the uniformity coefficient (Cu) and the coefficient of gradation (Cc) of the mixture?arrow_forward
- The grain-size characteristics of a soil are given in the following table. a. Draw the grain-size distribution curve. b. Determine the percentages of gravel, sand, silt, and clay according to the MIT system. c. Repeat Part b using the USDA system. d. Repeat Part b using the AASHTO system.arrow_forwardRepeat Problem 2.14 with the following values: Gs = 2.75, temperature of water = 21C, t = 88 min, and L = 11.7 cm. 2.14 A hydrometer test has the following result: Gs = 2.65, temperature of water = 26 C, and L = 10.4 cm at 45 minutes after the start of sedimentation (see Figure 2.25). What is the diameter D of the smallest-size particles that have settled beyond the zone of measurement at that time (that is, t = 45 min)? Figure 2.25 ASTM 152H type of hydrometer placed inside the sedimentation cylinder (Courtesy of Khaled Sobhan, Florida Atlantic University, Boca Raton, Florida)arrow_forwardRedo Problem 2.7 according to the AASHTO system (Table 2.3). 2.7 The particle characteristics of a soil are given below. Draw the particle-size distribution curve and find the percentages of gravel, sand, silt, and clay according to the MIT system (Table 2.3).arrow_forward
- A hydrometer test has the following result: Gs = 2.65, temperature of water = 26 C, and L = 10.4 cm at 45 minutes after the start of sedimentation (see Figure 2.25). What is the diameter D of the smallest-size particles that have settled beyond the zone of measurement at that time (that is, t = 45 min)? Figure 2.25 ASTM 152H type of hydrometer placed inside the sedimentation cylinder (Courtesy of Khaled Sobhan, Florida Atlantic University, Boca Raton, Florida)arrow_forwardThe particle characteristics of a soil are given below. Draw the particle-size distribution curve and find the percentages of gravel, sand, silt, and clay according to the MIT system (Table 2.3).arrow_forwardRefer to the soil in Problem 4.5. Using the Casagrande plasticity chart, graphically estimate the shrinkage limit of the soil as shown in Figure 4.22. 4.5 The following data were obtained by conducting liquid limit and plastic limit tests on a soil collected from the site. Liquid limit tests: Plastic limit test: PL = 19.3% a. Draw the flow curve and determine the liquid limit. b. Using the Casagrande plasticity chart (Figure 4.21), determine the soil type.arrow_forward
- Since laboratory or field experiments are generally expensive and time consuming, geotechnical engineers often have to rely on empirical relationships to predict design parameters. Section 6.6 presents such relationships for predicting optimum moisture content and maximum dry unit weight. Let us use some of these equations and compare our results with known experimental data. The following table presents the results from laboratory compaction tests conducted on a wide range of fine-grained soils using various compactive efforts (E). Based on the soil data given in the table, determine the optimum moisture content and maximum dry unit weight using the empirical relationships presented in Section 6.6. a. Use the Osman et al. (2008) method [Eqs. (6.15) through (6.18)]. b. Use the Gurtug and Sridharan (2004) method [Eqs. (6.13) and (6.14)]. c. Use the Matteo et al. (2009) method [Eqs. (6.19) and (6.20)]. d. Plot the calculated wopt against the experimental wopt, and the calculated d(max) with the experimental d(max). Draw a 45 line of equality on each plot. e. Comment on the predictive capabilities of various methods. What can you say about the inherent nature of empirical models?arrow_forwardThe properties of seven different clayey soils are shown below (Skempton and Northey, 1952). Investigate the relationship between the strength and plasticity characteristics by performing the following tasks: a. Estimate the plasticity index for each soil using Skemptons definition of activity [Eq. (4.28)]. b. Estimate the probable mineral composition of the clay soils based on PI and A (use Table 4.3) c. Sensitivity (St) refers to the loss of strength when the soil is remolded or disturbed. It is defined as the ratio of the undisturbed strength (f-undisturbed) to the remolded strength (f-remolded)) at the same moisture content [Eq. (12.49)]. From the given data, estimate f-remolded for the clay soils. d. Plot the variations of undisturbed and remolded shear strengths with the activity, A, and explain the observed behavior.arrow_forwardHow is the plasticity index of a soil determined?arrow_forward
arrow_back_ios
SEE MORE QUESTIONS
arrow_forward_ios
Recommended textbooks for you
 Principles of Geotechnical Engineering (MindTap C...Civil EngineeringISBN:9781305970939Author:Braja M. Das, Khaled SobhanPublisher:Cengage Learning
 Principles of Foundation Engineering (MindTap Cou...Civil EngineeringISBN:9781337705028Author:Braja M. Das, Nagaratnam SivakuganPublisher:Cengage Learning
 Fundamentals of Geotechnical Engineering (MindTap...Civil EngineeringISBN:9781305635180Author:Braja M. Das, Nagaratnam SivakuganPublisher:Cengage Learning
 Principles of Foundation Engineering (MindTap Cou...Civil EngineeringISBN:9781305081550Author:Braja M. DasPublisher:Cengage Learning
 Construction Materials, Methods and Techniques (M...Civil EngineeringISBN:9781305086272Author:William P. Spence, Eva KultermannPublisher:Cengage Learning
 Traffic and Highway EngineeringCivil EngineeringISBN:9781305156241Author:Garber, Nicholas J.Publisher:Cengage Learning

Principles of Geotechnical Engineering (MindTap C...
Civil Engineering
ISBN:9781305970939
Author:Braja M. Das, Khaled Sobhan
Publisher:Cengage Learning

Principles of Foundation Engineering (MindTap Cou...
Civil Engineering
ISBN:9781337705028
Author:Braja M. Das, Nagaratnam Sivakugan
Publisher:Cengage Learning

Fundamentals of Geotechnical Engineering (MindTap...
Civil Engineering
ISBN:9781305635180
Author:Braja M. Das, Nagaratnam Sivakugan
Publisher:Cengage Learning

Principles of Foundation Engineering (MindTap Cou...
Civil Engineering
ISBN:9781305081550
Author:Braja M. Das
Publisher:Cengage Learning

Construction Materials, Methods and Techniques (M...
Civil Engineering
ISBN:9781305086272
Author:William P. Spence, Eva Kultermann
Publisher:Cengage Learning

Traffic and Highway Engineering
Civil Engineering
ISBN:9781305156241
Author:Garber, Nicholas J.
Publisher:Cengage Learning