Principles of Geotechnical Engineering (MindTap Course List)
9th Edition
ISBN: 9781305970939
Author: Braja M. Das, Khaled Sobhan
Publisher: Cengage Learning
expand_more
expand_more
format_list_bulleted
Concept explainers
Videos
Textbook Question
Chapter 2, Problem 2.2CTP
Refer to Problem 2.C.1. Results of the sieve analysis for Soils A, B, and C are given below. To obtain a more representative sample for further geotechnical testing, a ternary blend is created by uniformly mixing 8000 kg of each soil. Answer the following questions.
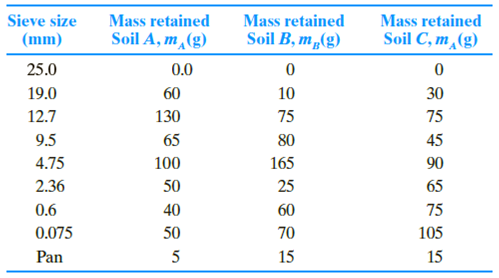
a. If a sieve analysis is conducted on the mixture using the same set of sieves as shown above, compute the mass retained (as a percentage) and cumulative percent passing in each sieve.
b. What would be the uniformity coefficient (Cu) and the coefficient of gradation (Cc) of the mixture?
Expert Solution & Answer

Trending nowThis is a popular solution!

Students have asked these similar questions
12. Situation 12 - The given data shows the sieve analysis of three soil samples.
a. Compute for the group index of Soil B.
b Compute for the group index of Soil A.
c. Compute for the group index of Soil C
Situation 12 - The given data shows the sieve analysis of three soil samples.
Compute for the group index of Soil A, B and C.
find the following:
a. What is the value of the percent passing for sieve with 2 mm. opening in percentage?
b. What is the value of the percent passing for sieve with 150 μm. opening in percentage?
c. What is the value of the Effective Size of soil in mm.?
d. What is the value of the coefficient of gradation?e.What is the value of the coefficient of uniformity?
f. What are the percentages of gravel, sand, and Fines using the limits indicated by USCS?
g. What are the percentages of gravel, sand, silt and clay using the limits indicated by MIT?
h. What are the percentages of gravel, sand, silt and clay using the limits indicated by AASHTO?
i. What are the percentages of gravel, sand, silt and clay using the limits indicated by USDA?
Chapter 2 Solutions
Principles of Geotechnical Engineering (MindTap Course List)
Ch. 2 - For a gravel with D60 = 0.48 mm, D30 = 0.25 mm,...Ch. 2 - Prob. 2.2PCh. 2 - Prob. 2.3PCh. 2 - The following are the results of a sieve analysis....Ch. 2 - Repeat Problem 2.4 with the following data. 2.4...Ch. 2 - Repeat Problem 2.4 with the following data. 2.4...Ch. 2 - Repeat Problem 2.4 with the following data. 2.4...Ch. 2 - The following are the results of a sieve and...Ch. 2 - Repeat Problem 2.8 using the following data. 2.8...Ch. 2 - Repeat Problem 2.8 using the following data. 2.8...
Ch. 2 - The grain-size characteristics of a soil are given...Ch. 2 - Repeat Problem 2.11 with the following data. 2.11...Ch. 2 - Repeat Problem 2.11 with the following data. 2.11...Ch. 2 - A hydrometer test has the following result: Gs =...Ch. 2 - Repeat Problem 2.14 with the following values: Gs...Ch. 2 - Three groups of students from the Geotechnical...Ch. 2 - Refer to Problem 2.C.1. Results of the sieve...
Knowledge Booster


Learn more about
Need a deep-dive on the concept behind this application? Look no further. Learn more about this topic, civil-engineering and related others by exploring similar questions and additional content below.Similar questions
- Repeat Problem 2.4 with the following data. 2.4 The following are the results of a sieve analysis. a. Determine the percent finer than each sieve and plot a grain-size distribution curve. b. Determine D10, D30, and D60 for each soil. c. Calculate the uniformity coefficient Cu. d. Calculate the coefficient of gradation Cc.arrow_forwardRepeat Problem 2.8 using the following data. 2.8 The following are the results of a sieve and hydrometer analysis. a. Draw the grain-size distribution curve. b. Determine the percentages of gravel, sand, silt and clay according to the MIT system. c. Repeat Part b according to the USDA system. d. Repeat Part b according to the AASHTO system.arrow_forwardRepeat Problem 2.11 with the following data. 2.11 The grain-size characteristics of a soil are given in the following table. a. Draw the grain-size distribution curve. b. Determine the percentages of gravel, sand, silt, and clay according to the MIT system. c. Repeat Part b using the USDA system. d. Repeat Part b using the AASHTO system.arrow_forward
- The following data were obtained by conducting liquid limit and plastic limit tests on a soil collected from the site. Liquid limit tests: Plastic limit test: PL = 19.3% a. Draw the flow curve and determine the liquid limit. b. Using the Casagrande plasticity chart (Figure 4.21), determine the soil type.arrow_forwardFALLING HEAD PERMEABILITY TEST OTHER QUESTIONS: 1. What is the importance of finding the coefficient of permeability of soils? 2. What is the difference between constant head permeability test and falling head permeability test? 3. Why is it needed to fully saturate the soil first before conducting the experiment? 4. Why is there a need to remove air bubbles from the specimen?arrow_forwardA soil sample has the following size distribution; 4 to 2mm = 17%, 2 to 0.05 mm = 12%, 0.5 to 0.005 mm = 22% 0.005 to 0.002 mm = 10% <0.002 mm = 39% what are the percentages of clay, silt, and sand? Using USDA calssification what is the modifier and tetural classificationarrow_forward
- Q#3 :The following are the results of different tests on soil samples are provided in the following table. Classify the soil according to AASTHO classification and determine the Group Index in each case. You may use the information provided.arrow_forwardFollowing are the results from the liquid and plastic limit tests for a soil. Liquid limit test: Plastic limit test: PL = 18.7%a. Draw the flow curve and obtain the liquid limit.b. What is the plasticity index of the soil? c. Determine the liquidity index of the soil when the in situmoisture content is 26%arrow_forwardThe soil passing the no. 200 sieve was used to conduct a hydrometer test. The results are shown in the table below. What are the amounts of clays and silts in the soil?arrow_forward
- A Soils laboratory technician carries out a standard Proctor test on an SP-type soil and observes, at low water content, a decrease in unit weight with increase in water content. Why does this occur? Plot the compaction curve you expect to be derived from this test. How should the technician proceed, and with what aim?arrow_forwardA 500g (assume no wastes) of dry soil was used for a soil mechanical analysis. The mass of soil retained in each sieve, and hydrometer analysis data are given in Table 1 and Table 2, respectively. a. what is the value of the effective size of soil in mm? b. what is the value of the coefficient of gradation? c. what are the percentages of grave sand silt and clay using the limits indicated by USDAarrow_forwardThe following are the results from the liquid limit tests for a soil: Number of Blows, N Moisture Content, % 16 38.3 21 33.4 34 29.1 a) Draw the flow curve and obtain the liquid limit. b) If the Plastic Limit is determined to be 8%, what is the Plasticity Index of the soil? c) What is the Liquidity Index of the soil if the in situ w = 35%? What does this specific result tell us about this soil?arrow_forward
arrow_back_ios
SEE MORE QUESTIONS
arrow_forward_ios
Recommended textbooks for you
 Principles of Geotechnical Engineering (MindTap C...Civil EngineeringISBN:9781305970939Author:Braja M. Das, Khaled SobhanPublisher:Cengage Learning
 Fundamentals of Geotechnical Engineering (MindTap...Civil EngineeringISBN:9781305635180Author:Braja M. Das, Nagaratnam SivakuganPublisher:Cengage Learning
 Principles of Foundation Engineering (MindTap Cou...Civil EngineeringISBN:9781337705028Author:Braja M. Das, Nagaratnam SivakuganPublisher:Cengage Learning
Principles of Geotechnical Engineering (MindTap C...
Civil Engineering
ISBN:9781305970939
Author:Braja M. Das, Khaled Sobhan
Publisher:Cengage Learning
Fundamentals of Geotechnical Engineering (MindTap...
Civil Engineering
ISBN:9781305635180
Author:Braja M. Das, Nagaratnam Sivakugan
Publisher:Cengage Learning
Principles of Foundation Engineering (MindTap Cou...
Civil Engineering
ISBN:9781337705028
Author:Braja M. Das, Nagaratnam Sivakugan
Publisher:Cengage Learning
How Are Highways Designed?; Author: Practical Engineering;https://www.youtube.com/watch?v=9XIjqdk69O4;License: Standard Youtube License