
Economics (MindTap Course List)
13th Edition
ISBN: 9781337617383
Author: Roger A. Arnold
Publisher: Cengage Learning
expand_more
expand_more
format_list_bulleted
Related questions
Question
not use ai please

Transcribed Image Text:Q5.
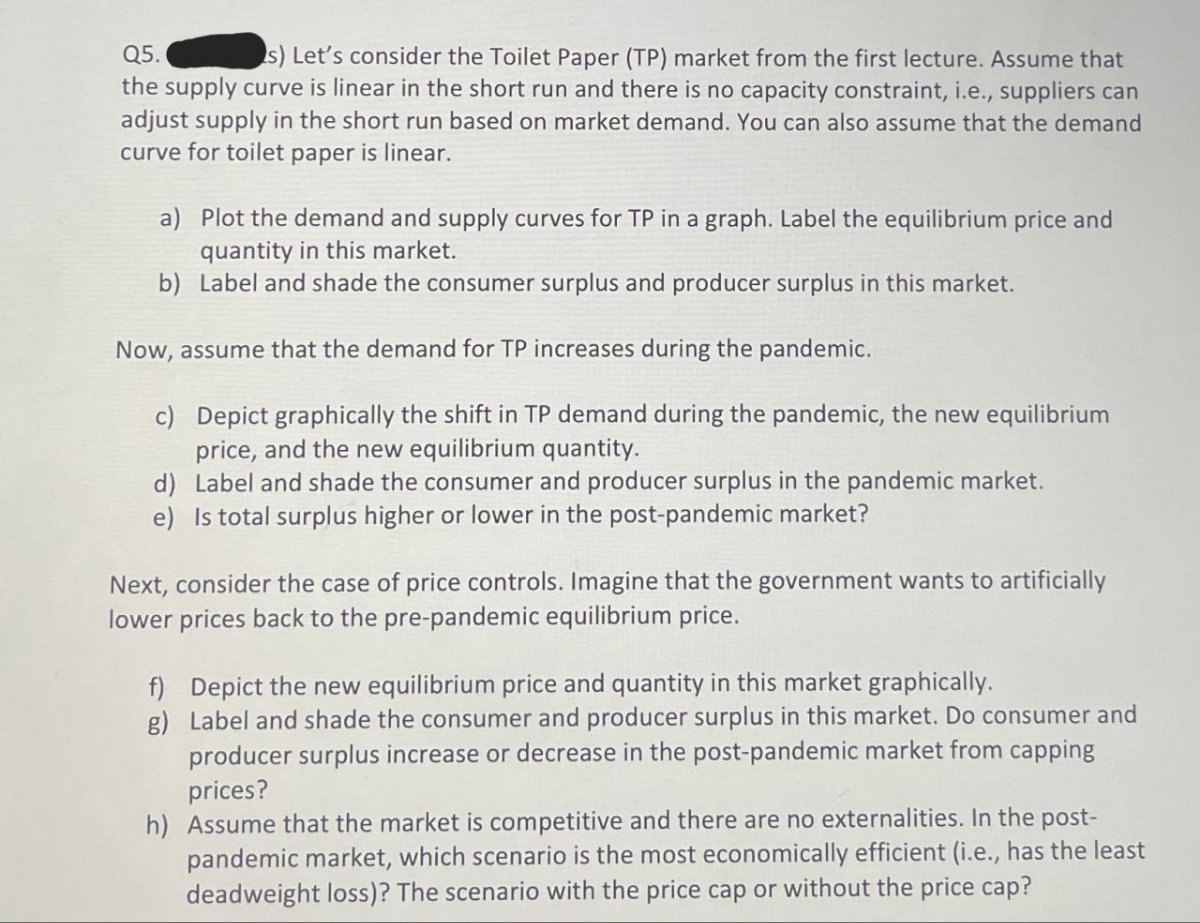
s) Let's consider the Toilet Paper (TP) market from the first lecture. Assume that
the supply curve is linear in the short run and there is no capacity constraint, i.e., suppliers can
adjust supply in the short run based on market demand. You can also assume that the demand
curve for toilet paper is linear.
a) Plot the demand and supply curves for TP in a graph. Label the equilibrium price and
quantity in this market.
b) Label and shade the consumer surplus and producer surplus in this market.
Now, assume that the demand for TP increases during the pandemic.
c) Depict graphically the shift in TP demand during the pandemic, the new equilibrium
price, and the new equilibrium quantity.
d) Label and shade the consumer and producer surplus in the pandemic market.
e) Is total surplus higher or lower in the post-pandemic market?
Next, consider the case of price controls. Imagine that the government wants to artificially
lower prices back to the pre-pandemic equilibrium price.
f) Depict the new equilibrium price and quantity in this market graphically.
g) Label and shade the consumer and producer surplus in this market. Do consumer and
producer surplus increase or decrease in the post-pandemic market from capping
prices?
h) Assume that the market is competitive and there are no externalities. In the post-
pandemic market, which scenario is the most economically efficient (i.e., has the least
deadweight loss)? The scenario with the price cap or without the price cap?
Expert Solution
This question has been solved!
Explore an expertly crafted, step-by-step solution for a thorough understanding of key concepts.

Step by stepSolved in 2 steps with 12 images

Knowledge Booster

Similar questions
- The figure depicts the market for shoes. Suppose that a less expensive material for making shoes is developed. What effect will this event have on supply and demand in the shoe market? Demonstrate your answer graphically. Instructions: Use the tool provided "New line" to draw either a new demand or supply curve that reflects the market effect of this event. Plot only the endpoints of the line. if a less expensive material developed, the- will-. This will cause the equilibrium price to- and the equilibrium- quantity to-arrow_forwardConsider the market for pens. Suppose that increased medical concems over lead pencils have led schools to steer away from pendl use In favor of pens. Moreover, the price of ink, an important input in pen production, has increased considerably. On the following graph, labeled Scenario 1, indicate the effect these two events have on the demand for and SUpply of pens. Note: Select and drag one or both of the curves to the desired position. Curves will snap into position, so if you try to move a curve and it snaps back to its original position, just drag it a little farther. Scenario 1 10 -0- 9 Supply Demand 8 Supply Demand 10 7 3 4 QUANTITY (MIllions of pens) 5 6 MacBook Air FIV F10 F7 吕0 F3 DO0 F4 F5 PRICE (Dollars per pen)arrow_forward1. A) Suppose that the demand for milk increases because a new beauty treatment is discovered that uses milk. Analyze the effects of this change on the equilibrium for milk and the equilibrium for cookies by thinking about the diagrams. B) Now to convince yourself that your graphical answer is right, consider the following supply and demand equations for milk and cookies. Qd M = 40 – 2PM – PC Qd C = 40 – 2PC – PM Qs M = PM Qs C = PC i) Solve for the equilibrium prices and quantities. ii) Now suppose that the demand for milk increases so that the demand for milk is given by Qd M= 80 – 2PM – PC. Solve for the new equilibrium prices and quantities of milk and cookies.arrow_forward
- es The graph below shows the market for oats. Price per bushel 12 11 10 9 8 10 432 S 4 0 10 50 70 100¹10120 30 90 80 60 40 20 Quantity per period (in millions of bushels) S Tools Sz Prev 4 of 8 # Next >arrow_forwardThe demand and supply of muffins in a small town are shown in the graph below. A great review of the town's bakeries in a major newspaper causes the demand for muffins to increase by 2 muffins at each price. Draw the new demand curve. (Be sure to make the new demand curve the same length as the original using the segment tool.) Then add a point at the new equilibrium using the point tool. +Move Price per muffin 8 6 5 D 3 2 0 Point Segment N 3 6 Quantity of muffins per week Undo -00 Redo x Reset 9arrow_forwardConsider the market for automobiles, and draw representative supply and demand curves.a) Suppose that the price of gasoline rises, and at the same time, the price of steel (an input to automobile production) falls. Show this on your graph. If you have no other information, what can you say about the change in equilibrium price and quantity?b) Now suppose that you have the additional information that the rise in gasoline prices has been relatively large, while the reduction in steel costs has been relatively small. How would this change your answer to (a)? Note:- Do not provide handwritten solution. Maintain accuracy and quality in your answer. Take care of plagiarism. Answer completely. You will get up vote for sure.arrow_forward
- Please answer all parts.arrow_forwardIn a sunflower market, consumers have demand function for a sunflower given by P = -4Qd + 21 where Pis the market price of sunflower and Qd is quantity of sunflower demanded. On the other hand, suppliers of sunflower have supply function given by P = 2Qs + 3where P is the market price of sunflower and Qd is quantity of sunflower supplied. 10. Using demand and supply functions, calculate the market equilibrium price and quantity of sunflower. 11. Calculate for the consumer surplus, producer surplus, and total surplus at the market equilibrium (in values).arrow_forwardQuestion 1 Consider a rice farmer planting two (2) types of rice, white and brown rice, concurrently in his rice field using the same resources and technology and harvesting them at the same time. Given that consumers like to mix both white and brown rice in their daily consumption, explain the effect on the white rice market when the price of brown rice increases. Support your answers with suitable white rice market diagrams. Consider a farmer that produces both white and brown rice. It is discovered that the demand for brown rice is relatively more inelastic compared to the demand for white rice. Initially the price of both white and brown rice is the same and the farmer produces the same quantity of white and brown rice. Now there is an improvement in agricultural technologies that affect both white and brown rice equally. Employ the demand and supply model to compare and contrast the effects on the equilibrium price and quantity of both white and brown rice…arrow_forward
- In the graph, an increase in supply would cause a move from which equilibrium point to another, other things being equal. Price P P E₂ a) A decrease in input prices b) An improvement in technology c) An increase in input prices d) An increase in consumer income E O OTO Q₂ Quantity of good X Which of the following might cause a shift from S1 to S₂? Di D:arrow_forwardThis problem involves solving demand and supply equations together to determine price and quantity. a. Consider a demand curve of the form QD=-2P+20, where QD is the quantity demanded of a good and P is the price of the good. Graph this demand curve. Also draw a graph of the supply curve Qs =2P-4, where Qs is the quantity supplied. Be sure to put P on the vertical axis and Q on the horizontal axis. Assume that all the Qs and Ps are nonnegative for parts a, b, and c. At what values of P and Q do these curves intersect-that is, where does QD = Qs ? b. Now, suppose at each price that individuals demand four more units of output-that the demand curve shifts to QD - 2P+24. Graph this new demand curve. At what values of P and Q does the new demand curve intersect the old supply curve-that is, where does QD = Qs ? c. Now finally, suppose the supply curve shifts to Q's=2P-8. Graph this new supply curve. At what values of P and Q does QD=Q's? Show all working calculations and label garph with…arrow_forwardgraph the line of demand and the of line of supply showing point of equilibrium of these two equations: Qsupply = 2.5P + 30Qdemand= -20P + 370arrow_forward
arrow_back_ios
SEE MORE QUESTIONS
arrow_forward_ios
Recommended textbooks for you
- Economics (MindTap Course List)EconomicsISBN:9781337617383Author:Roger A. ArnoldPublisher:Cengage Learning


 Exploring EconomicsEconomicsISBN:9781544336329Author:Robert L. SextonPublisher:SAGE Publications, Inc

Economics (MindTap Course List)
Economics
ISBN:9781337617383
Author:Roger A. Arnold
Publisher:Cengage Learning
Exploring Economics
Economics
ISBN:9781544336329
Author:Robert L. Sexton
Publisher:SAGE Publications, Inc