ENGR.ECONOMIC ANALYSIS
14th Edition
ISBN: 9780190931919
Author: NEWNAN
Publisher: Oxford University Press
expand_more
expand_more
format_list_bulleted
Question

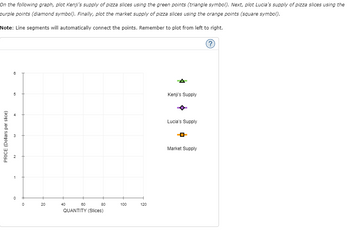
Transcribed Image Text:On the following graph, plot Kenji's supply of pizza slices using the green points (triangle symbol). Next, plot Lucia's supply of pizza slices using the
purple points (diamond symbol). Finally, plot the market supply of pizza slices using the orange points (square symbol).
Note: Line segments will automatically connect the points. Remember to plot from left to right.
PRICE (Dollars per slice)
6
CO
5
A
w
N
1
0
0
20
40
60
80
QUANTITY (Slices)
100
120
Kenji's Supply
Lucia's Supply
Market Supply
?

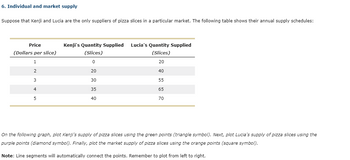
Transcribed Image Text:6. Individual and market supply
Suppose that Kenji and Lucia are the only suppliers of pizza slices in a particular market. The following table shows their annual supply schedules:
Price
(Dollars per slice)
1
2
3
4
5
Kenji's Quantity Supplied
(Slices)
0
20
30
35
40
Lucia's Quantity Supplied
(Slices)
20
40
55
65
70
On the following graph, plot Kenji's supply of pizza slices using the green points (triangle symbol). Next, plot Lucia's supply of pizza slices using the
purple points (diamond symbol). Finally, plot the market supply of pizza slices using the orange points (square symbol).
Note: Line segments will automatically connect the points. Remember to plot from left to right.
Expert Solution
This question has been solved!
Explore an expertly crafted, step-by-step solution for a thorough understanding of key concepts.
This is a popular solution
Trending nowThis is a popular solution!
Step by stepSolved in 3 steps with 2 images

Knowledge Booster
Learn more about
Need a deep-dive on the concept behind this application? Look no further. Learn more about this topic, economics and related others by exploring similar questions and additional content below.Similar questions
- 3. Individual and market demand Suppose that Hubert and Kate are the only consumers of pizza slices in a particular market. The following table shows their weekly demand schedules: Price (Dollars per slice) 1 2 3 4 5 Hubert's Quantity Demanded (Slices) 8 5 3 1 0 Kate's Quantity Demanded (Slices) 16 12 8 4 2 On the following graph, plot Hubert's demand for pizza slices using the green points (triangle symbol). Next, plot Kate's demand for pizza slices using the purple points (diamond symbol). Finally, plot the market demand for pizza slices using the blue points (circle symbol). Note: Line segments will automatically connect the points. Remember to plot from left to right.arrow_forwardSolve it!arrow_forwardSuppose a decrease in the world demand for desktop computers causes the price of desktop computers to fall from $600 to $500. Before the fall in demand, Juna, a local computer dealer in Japan, used to produce 9,000 desktop computers and exported 50 percent of it to other countries every week. However, after the fall in demand, Juna reduced its production to 8,000 units and exports only 40 percent of its total output.a. What are the changes in the quantity sold to domestic consumersb. What are the changes in the consumer surplus?c. Sketch a diagram to illustrate the changes for Juna.arrow_forward
- pls, solve this ques within 10-15 minutes with clear explanations and also explain why other options are wrong I'll give you multiple upvotes.arrow_forward. Individual and market demand Suppose that Eric and Ginny are the only consumers of pizza slices in a particular market. The following table shows their weekly demand schedules: Price Eric’s Quantity Demanded Ginny’s Quantity Demanded (Dollars per slice) (Slices) (Slices) 1 6 16 2 3 12 3 2 8 4 1 6 5 0 4 On the following graph, plot Eric’s demand for pizza slices using the green points (triangle symbol). Next, plot Ginny’s demand for pizza slices using the purple points (diamond symbol). Finally, plot the market demand for pizza slices using the blue points (circle symbol). Note: Line segments will automatically connect the points. Remember to plot from left to right. ( the graph has attached as an image)arrow_forwardThe demand for corn (measured in billions of bushels) is given by Con = 5 - 2Pom + 4Ppotutoes - 0.25Putter + 0.0003M. The supply of corn is given by O=9+ 5Pun - 2Puet -1.25Pybeans a. If potatoes cost $0.75 per pound, butter costs $8.00 per pound, diesel fuel costs $3.00 per gallon, soybeans cost $16.00 per bushel, and average income, M, is $40,000 per year, what is the equilibrium price of corn as determined by the demand and supply functions? Instructions: Round your answer to 1 decimal place, b. How much corn is bought and sold (equilibrium quantity? Instructions: Round your answer to 1 decimal place. Obillion bushels. c. If the price of diesel fuel increases to $4.50 per gallon, what is the new equilibrium price? Instructions: Round your answers to 2 decimal places. If the price of diesel fuel increases to $4.50 per gallon, what is the new equilibrium quantity? billion bushels,arrow_forward
- Corn can be used to make tortilas or to make ethanol fuel for trucks and automobiles. Which of the following statements is incorect? O Increased production of com is likely to result in a higher price for both ethanal and tortillas. An increase in the price of ethanol is likely to resut in increased production of com Onereased demand for tortiles is likely to resut ina higher price for ethanol An increse in the price of ethanal liety to esut in an inose in the price of tortilasarrow_forward6. Individual and market supply Suppose that Paolo and Sharon are the only suppliers of ice cream cones in a particular market. The following table shows their monthly supply schedules: Price (Dollars per cone) PRICE (Dollars per cone) 6 5 2 0 1 0 2 3 4 5 Paolo's Quantity Supplied (Cones) 0 On the following graph, plot Paolo's supply of ice cream cones using the green points (triangle symbol). Next, plot Sharon's supply of ice cream using the purple points (diamond symbol). Finally, plot the market supply of ice cream cones using the orange points (square symbol). (?) 4 8 4 12 6 7 8 18 QUANTITY (Cones) Sharon's Quantity Supplied (Cones) 5 9 20 12 24 14 15 Paolo's Supply Sharon's Supply E Market Supply es Now, suppose that Sharon's twin brother, who has an identical cost structure and ice cream cones supply curve as Sharon, moves to the area, adding another producer to this market. As a result, there will be a the market supply curve because there will be a change in quantity suppliedarrow_forwardAnswer it Fast Please.arrow_forward
arrow_back_ios
arrow_forward_ios
Recommended textbooks for you

 Principles of Economics (12th Edition)EconomicsISBN:9780134078779Author:Karl E. Case, Ray C. Fair, Sharon E. OsterPublisher:PEARSON
 Engineering Economy (17th Edition)EconomicsISBN:9780134870069Author:William G. Sullivan, Elin M. Wicks, C. Patrick KoellingPublisher:PEARSON
 Principles of Economics (MindTap Course List)EconomicsISBN:9781305585126Author:N. Gregory MankiwPublisher:Cengage Learning
 Managerial Economics: A Problem Solving ApproachEconomicsISBN:9781337106665Author:Luke M. Froeb, Brian T. McCann, Michael R. Ward, Mike ShorPublisher:Cengage Learning
 Managerial Economics & Business Strategy (Mcgraw-...EconomicsISBN:9781259290619Author:Michael Baye, Jeff PrincePublisher:McGraw-Hill Education


Principles of Economics (12th Edition)
Economics
ISBN:9780134078779
Author:Karl E. Case, Ray C. Fair, Sharon E. Oster
Publisher:PEARSON

Engineering Economy (17th Edition)
Economics
ISBN:9780134870069
Author:William G. Sullivan, Elin M. Wicks, C. Patrick Koelling
Publisher:PEARSON

Principles of Economics (MindTap Course List)
Economics
ISBN:9781305585126
Author:N. Gregory Mankiw
Publisher:Cengage Learning

Managerial Economics: A Problem Solving Approach
Economics
ISBN:9781337106665
Author:Luke M. Froeb, Brian T. McCann, Michael R. Ward, Mike Shor
Publisher:Cengage Learning

Managerial Economics & Business Strategy (Mcgraw-...
Economics
ISBN:9781259290619
Author:Michael Baye, Jeff Prince
Publisher:McGraw-Hill Education