ENGR.ECONOMIC ANALYSIS
14th Edition
ISBN: 9780190931919
Author: NEWNAN
Publisher: Oxford University Press
expand_more
expand_more
format_list_bulleted
Question

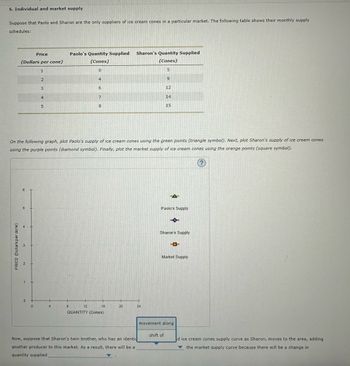
Transcribed Image Text:6. Individual and market supply
Suppose that Paolo and Sharon are the only suppliers of ice cream cones in a particular market. The following table shows their monthly supply
schedules:
Price
(Dollars per cone)
PRICE (Dollars per cone)
8
5
0
1
0
2
3
4
5
On the following graph, plot Paolo's supply of ice cream cones using the green points (triangle symbol). Next, plot Sharon's supply of ice cream cones
using the purple points (diamond symbol). Finally, plot the market supply of ice cream cones using the orange points (square symbol).
(?)
4
Paolo's Quantity Supplied Sharon's Quantity Supplied
(Cones)
0
(Cones)
5
4
9
6
8
7
12
8
16
QUANTITY (Cones)
20
24
Now, suppose that Sharon's twin brother, who has an identic
another producer to this market. As a result, there will be a
quantity supplied
12
14
15
Paolo's Supply
Sharon's Supply
shift of
P
Market Supply
movement along
d ice cream cones supply curve as Sharon, moves to the area, adding
the market supply curve because there will be a change in

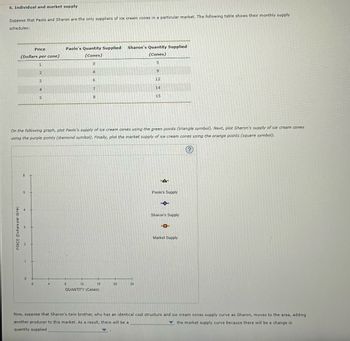
Transcribed Image Text:6. Individual and market supply
Suppose that Paolo and Sharon are the only suppliers of ice cream cones in a particular market. The following table shows their monthly supply
schedules:
Price
(Dollars per cone)
PRICE (Dollars per cone)
6
5
2
0
1
0
2
3
4
5
Paolo's Quantity Supplied
(Cones)
0
On the following graph, plot Paolo's supply of ice cream cones using the green points (triangle symbol). Next, plot Sharon's supply of ice cream
using the purple points (diamond symbol). Finally, plot the market supply of ice cream cones using the orange points (square symbol).
(?)
4
8
4
12
6
7
8
18
QUANTITY (Cones)
Sharon's Quantity Supplied
(Cones)
5
9
20
12
24
14
15
Paolo's Supply
Sharon's Supply
E
Market Supply
es
Now, suppose that Sharon's twin brother, who has an identical cost structure and ice cream cones supply curve as Sharon, moves to the area, adding
another producer to this market. As a result, there will be a
the market supply curve because there will be a change in
quantity supplied
Expert Solution
This question has been solved!
Explore an expertly crafted, step-by-step solution for a thorough understanding of key concepts.
Step by stepSolved in 4 steps with 1 images

Knowledge Booster
Learn more about
Need a deep-dive on the concept behind this application? Look no further. Learn more about this topic, economics and related others by exploring similar questions and additional content below.Similar questions
- Suppose both the demand for olives and the supply of olives decline by equal amounts over some time period. Use graphical analysis to show the effect on equilibrium price and quantity. Instructions: On the graph below, use your mouse to click and drag the supply and demand curves as necessary. D1 Quantity of olives Price of olivesarrow_forwardSuppose that Jacques and Kyoko are the only consumers of scented candles in a particular market. The following table shows their annual demand schedules: Price (Dollars per candle) 2 4 6 8 10 Jacques's Quantity Demanded Kyoko's Quantity Demanded (Candies) (Candles) 12 28 6 20 4 12 2 6 0 2arrow_forwardQuestion 1 Consider a rice farmer planting two (2) types of rice, white and brown rice, concurrently in his rice field using the same resources and technology and harvesting them at the same time. Given that consumers like to mix both white and brown rice in their daily consumption, explain the effect on the white rice market when the price of brown rice increases. Support your answers with suitable white rice market diagrams. Consider a farmer that produces both white and brown rice. It is discovered that the demand for brown rice is relatively more inelastic compared to the demand for white rice. Initially the price of both white and brown rice is the same and the farmer produces the same quantity of white and brown rice. Now there is an improvement in agricultural technologies that affect both white and brown rice equally. Employ the demand and supply model to compare and contrast the effects on the equilibrium price and quantity of both white and brown rice…arrow_forward
- Below are the supply and demand schedules for a video game. Price $200 $180 $160 $140 $120 $110 $100 $90 $80 $60 Quantity Demanded 10 15 20 25 30 35 40 45 50 55 Quantity Supplied 100 90 80 70 60 50 40 30 20 10 a) What is the equilibrium price? $ b) What is the equilibrium quantity? Assume that this video game receives a poor rating and consumers decide to purchase 45 less at each price. c) What is the new equilibrium price? $ d) What is the new equilibrium quantity? 100 40 units unitsarrow_forwardSuppose that Paolo and Sharon are the only suppliers of collectible action figures in a particular market. The following table shows their annual supply schedules: Price Paolo's Quantity Supplied Sharon's Quantity Supplied (Dollars per action figure) (Action figures) (Action figures) 10 A-Z 4 8. 18 6. 12 24 8. 14 28 10 16 30 On the following graph, plot Paolo's supply of collectible action figures using the green points (triange symbol). Next, plot Sharon's supply of collectible action figures using the purple points (diamond symbol). Finally, plot the market supply of collectible action figures using the orange points (square symbol). Note: Line segments will automatically connect the points. Remember to plot from left to right. 12 Paolo's Supply 10 Sharon's Supply MacBook Air F12 F11 F10 F9 FB F7 F6 吕0 F5 O00 F4 F3 * delete &arrow_forwardSuppose that the market for porcelain lupines in Freedonia is perfectly competitive and initially in a long nun equilibrium. Porcelain lupines are normal goods in Freedonia and are produced with a computer aided technology. Porcelain lupines and ceramic roses are substitutes while porcelain lupines and glass vases are complements. Suppose that a government report shows that people who possess ceramic roses are 72.74% more likely to suffer from erectile dysfunction. Describe with the use of diagrams the effects of this report upon the market for porcelain lupines in the short run and in the long run.arrow_forward
- Suppose that Paolo and Sharon are the only consumers of ice cream cones in a particular market. The following table shows their monthly demand schedules: Price Paolo’s Quantity Demanded Sharon’s Quantity Demanded (Dollars per cone) (Cones) (Cones) 1 8 16 2 5 12 3 3 8 4 1 6 5 0 4 On the following graph, plot Paolo’s demand for ice cream cones using the green points (triangle symbol). Next, plot Sharon’s demand for ice cream cones using the purple points (diamond symbol). Finally, plot the market demand for ice cream cones using the blue points (circle symbol). Note: Line segments will automatically connect the points. Remember to plot from left to right.arrow_forwardDemand is highest for watermelon in the summer, yet that is also when prices are lowest. Draw a graph showing both demand and supply for watermelon in both the summer and the winter (i.e. two demand curves and two supply curves on one graph) that illustrates how this situation could be possible.arrow_forwardThis problem involves solving demand and supply equations together to determine price and quantity. a. Consider a demand curve of the form QD=-2P+20, where QD is the quantity demanded of a good and P is the price of the good. Graph this demand curve. Also draw a graph of the supply curve Qs =2P-4, where Qs is the quantity supplied. Be sure to put P on the vertical axis and Q on the horizontal axis. Assume that all the Qs and Ps are nonnegative for parts a, b, and c. At what values of P and Q do these curves intersect-that is, where does QD = Qs ? b. Now, suppose at each price that individuals demand four more units of output-that the demand curve shifts to QD - 2P+24. Graph this new demand curve. At what values of P and Q does the new demand curve intersect the old supply curve-that is, where does QD = Qs ? c. Now finally, suppose the supply curve shifts to Q's=2P-8. Graph this new supply curve. At what values of P and Q does QD=Q's? Show all working calculations and label garph with…arrow_forward
- Suppose the daily demand for soda is given by P=4-(2/3)Q and the daily supply of soda is given by P= 1+ (1/3)Q, where P is the dollar price of a can of soda and Q is the number of cans of soda (in thousands). a. Sketch the demand curve and the supply curve. Instructions: Use the tools provided to draw the demand and supply curves. Plot each end point (4 points total). Ⓡ Price ($/can) 6 LO 5 + 3 2 1 0 Market for Soda 1 2 3 4 5 6 Quantity (1,000s of cans per day) Tools / Demand / Supplyarrow_forwardPlease give a detailed solution with an explanation. PLease make sure the graph is visible, clear, and detailed. Make sure to include the new equilibrium coordinate point as well.For the 2 blank answers here are the options:Blank Answer #1:decrease or increasearrow_forward. Individual and market demand Suppose that Eric and Ginny are the only consumers of pizza slices in a particular market. The following table shows their weekly demand schedules: Price Eric’s Quantity Demanded Ginny’s Quantity Demanded (Dollars per slice) (Slices) (Slices) 1 6 16 2 3 12 3 2 8 4 1 6 5 0 4 On the following graph, plot Eric’s demand for pizza slices using the green points (triangle symbol). Next, plot Ginny’s demand for pizza slices using the purple points (diamond symbol). Finally, plot the market demand for pizza slices using the blue points (circle symbol). Note: Line segments will automatically connect the points. Remember to plot from left to right. ( the graph has attached as an image)arrow_forward
arrow_back_ios
SEE MORE QUESTIONS
arrow_forward_ios
Recommended textbooks for you

 Principles of Economics (12th Edition)EconomicsISBN:9780134078779Author:Karl E. Case, Ray C. Fair, Sharon E. OsterPublisher:PEARSON
 Engineering Economy (17th Edition)EconomicsISBN:9780134870069Author:William G. Sullivan, Elin M. Wicks, C. Patrick KoellingPublisher:PEARSON
 Principles of Economics (MindTap Course List)EconomicsISBN:9781305585126Author:N. Gregory MankiwPublisher:Cengage Learning
 Managerial Economics: A Problem Solving ApproachEconomicsISBN:9781337106665Author:Luke M. Froeb, Brian T. McCann, Michael R. Ward, Mike ShorPublisher:Cengage Learning
 Managerial Economics & Business Strategy (Mcgraw-...EconomicsISBN:9781259290619Author:Michael Baye, Jeff PrincePublisher:McGraw-Hill Education


Principles of Economics (12th Edition)
Economics
ISBN:9780134078779
Author:Karl E. Case, Ray C. Fair, Sharon E. Oster
Publisher:PEARSON

Engineering Economy (17th Edition)
Economics
ISBN:9780134870069
Author:William G. Sullivan, Elin M. Wicks, C. Patrick Koelling
Publisher:PEARSON

Principles of Economics (MindTap Course List)
Economics
ISBN:9781305585126
Author:N. Gregory Mankiw
Publisher:Cengage Learning

Managerial Economics: A Problem Solving Approach
Economics
ISBN:9781337106665
Author:Luke M. Froeb, Brian T. McCann, Michael R. Ward, Mike Shor
Publisher:Cengage Learning

Managerial Economics & Business Strategy (Mcgraw-...
Economics
ISBN:9781259290619
Author:Michael Baye, Jeff Prince
Publisher:McGraw-Hill Education