
MATLAB: An Introduction with Applications
6th Edition
ISBN: 9781119256830
Author: Amos Gilat
Publisher: John Wiley & Sons Inc
expand_more
expand_more
format_list_bulleted
Related questions
Question

Transcribed Image Text:O The results aré štati
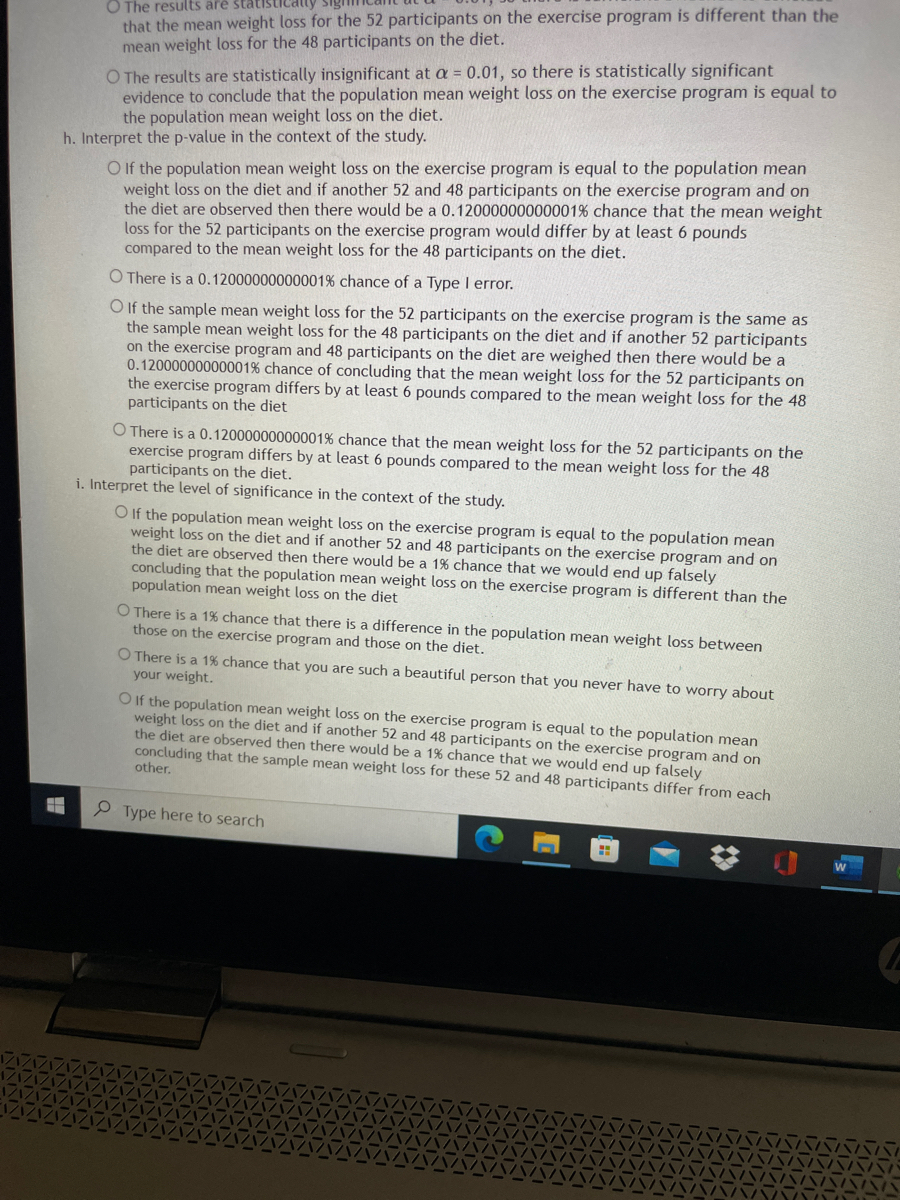
that the mean weight loss for the 52 participants on the exercise program is different than the
mean weight loss for the 48 participants on the diet.
O The results are statistically insignificant at a = 0.01, so there is statistically significant
evidence to conclude that the population mean weight loss on the exercise program is equal to
the population mean weight loss on the diet.
h. Interpret the p-value in the context of the study.
O If the population mean weight loss on the exercise program is equal to the population mean
weight loss on the diet and if another 52 and 48 participants on the exercise program and on
the diet are observed then there would be a 0.12000000000001% chance that the mean weight
loss for the 52 participants on the exercise program would differ by at least 6 pounds
compared to the mean weight loss for the 48 participants on the diet.
O There is a 0.12000000000001% chance of a Type I error.
O If the sample mean weight loss for the 52 participants on the exercise program is the same as
the sample mean weight loss for the 48 participants on the diet and if another 52 participants
on the exercise program and 48 participants on the diet are weighed then there would be a
0.12000000000001% chance of concluding that the mean weight loss for the 52 participants on
the exercise program differs by at least 6 pounds compared to the mean weight loss for the 48
participants on the diet
O There is a 0.12000000000001% chance that the mean weight loss for the 52 participants on the
exercise program differs by at least 6 pounds compared to the mean weight loss for the 48
participants on the diet.
i. Interpret the level of significance in the context of the study.
O If the population mean weight loss on the exercise program is equal to the population mean
weight loss on the diet and if another 52 and 48 participants on the exercise program and on
the diet are observed then there would be a 1% chance that we would end up falsely
concluding that the population mean weight loss on the exercise program is different than the
population mean weight loss on the diet
O There is a 1% chance that there is a difference in the population mean weight loss between
those on the exercise program and those on the diet.
O There is a 1% chance that you are such a beautiful person that you never have to worry about
your weight.
O f the population mean weight loss on the exercise program is equal to the population mean
weight loss on the diet and if another 52 and 48 participants on the exercise program and on
the diet are observed then there would be a 1% chance that we would end up falsely
concluding that the sample mean weight loss for these 52 and 48 participants differ from each
other.
P Type here to search

Transcribed Image Text:Is a weight loss program based on exercise just as effective as a program based on diet? The 52 overweight
people put on a strict one year exercise program lost an average of 27 pounds with a standard deviation of
10 pounds. The 48 overweight people put on a strict one year diet lost an average of 21 pounds with a
standard deviation of 8 pounds. What can be concluded at the a = 0.01 level of significance?
%3D
a. For this study, we should use Select an answer
b. The null and alternative hypotheses would be:
Ho: Select an answer v Select an answer v
Select an answer v (please enter a decimal)
H: Select an answer v
Select an answer v
Select an answer v (Please enter a decimal)
c. The test statistic ? v =
(please show your answer to 3 decimal places.)
%3D
d. The p-value =
(Please show your answer to 4 decimal places.)
%3!
e. The p-value is ? v a
f. Based on this, we should Select an answer v the null hypothesis.
g. Thus, the final conclusion is that ...
O The results are statistically insignificant at a = 0.01, so there is insufficient evidence to
conclude that the population mean weight loss on the exercise program is different than the
population mean weight loss on the diet.
%3D
O The results are statistically significant at = 0.01, so there is sufficient evidence to conclude
that the population mean weight loss on the exercise program is different than the population
mean weight loss on the diet.
O The results are statistically significant at a = 0.01, so there is sufficient evidence to conclude
that the mean weight loss for the 52 participants on the exercise program is different than the
mean weight loss for the 48 participants on the diet.
O The results are statistically insignificant at a = 0.01, so there is statistically significant
evidence to conclude that the population mean weight loss on the exercise program is equal to
the population mean weight loss on the diet.
h. Interpret the p-value in the context of the study.
O If the population mean weight loss on the exercise program is equal to the population mean
weight loss on the diet and if another 52 and 48 participants on the exercise program and on
the diet are observed then there would be a 0.12000000000001% chance that the mean weight
loss for the 52 participants on the exercise program would differ by at least 6 pounds
compared to the mean weight loss for the 48 participants on the diet.
O There is a 0.12000000000001% chance of a Type I error.
O If the sample mean weight loss for the 52 participants on the exercise program is the same as
the sample mean weight loss for the 48 participants on the diet and if another 52 participants
nn the exercise prooram and 48 narticinants.on the diet are weighed then there would be a
P Type here to search
bp
Expert Solution
This question has been solved!
Explore an expertly crafted, step-by-step solution for a thorough understanding of key concepts.

Step by stepSolved in 2 steps

Knowledge Booster

Similar questions
- In a test of the effectiveness of garlic for lowering cholesterol, 36 subjects were treated with raw garlic. Cholesterol levels were measured before and after the treatment. The changes (before minus after) in their levels of LDL cholesterol (in mg/dL) have a mean of 0.7 and a standard deviation of 23.1. Use a 0.01 significance level to test the claim that with garlic treatment, the mean change in LDL cholesterol is greater than 0. What do the results suggest about the effectiveness of the garlic treatment? Assume that a simple random sample has been selected. Identify the null and alternative hypotheses, test statistic, P-value, and state the final conclusion that addresses the original claim.arrow_forwardTraffic Highway planners investigated the relationshipbetween traffic Density (number of automobiles per mile)and the average Speed of the traffic on a moderately largecity thoroughfare. The data were collected at the samelocation at 10 different times over a span of 3 months.They found a mean traffic Density of 68.6 cars per mile(cpm) with standard deviation of 27.07 cpm. Overall, the cars’ average Speed was 26.38 mph, with standard devia-tion of 9.68 mph. These researchers found the regression line for these data to be Speed = 50.55 - 0.352 Density.a) What is the value of the correlation coefficientbetween Speed and Density?b) What percent of the variation in average Speed isexplained by traffic Density? c) Predict the average Speed of traffic on the thorough-fare when the traffic Density is 50 cpm. d) What is the value of the residual for a traffic Densityof 56 cpm with an observed Speed of 32.5 mph?e) The data set initially included the point Density =125 cpm, Speed = 55 mph. This…arrow_forwardLow-fat or low-carb? Are low-fat diets or low-carb diets more effective for weight loss? A sample of 77 subjects went on a low-carbohydrate diet for six months. At the end of that time, the sample mean weight loss was 4.7 kilograms with a sample standard deviation of 7.16 kilograms. A second sample of 79 subjects went on a low-fat diet. Their sample mean weight loss was 2.6 kilograms with a standard deviation of 5.90 kilograms. Can you conclude that the mean weight loss differs between the two diets? Let 4, denote the mean weight lost on the low-carb diet and u, denote the mean weight lost on the low-fat diet. Use the a = 0.01 level and the TI-84 Plus calculator. Compute the -value. Round the answer to four decimal places. Determine whether to reject H0 State a conclusionarrow_forward
- In a test of the effectiveness of garlic for lowering cholesterol, 81 subjects were treated with raw garlic. Cholesterol levels were measured before and after the treatment. The changes (before minus after) in their levels of LDL cholesterol (in mg/dL) have a mean of 0.9 and a standard deviation of 16.7. Use a 0.01 significance level to test the claim that with garlic treatment, the mean change in LDL cholesterol is greater than 0. What do the results suggest about the effectiveness of the garlic treatment? Assume that a simple random sample has been selected. Identify the null and alternative hypotheses, test statistic, P-value, and state the final conclusion that addresses the original claim. What are the null and alternative hypotheses?arrow_forwardIn a test of the effectiveness of garlic for lowering cholesterol, 36 subjects were treated with raw garlic. Cholesterol levels were measured before and after the treatment. The changes (before minus after) in their levels of LDL cholesterol (in mg/dL) have a mean of 0.7 and a standard deviation of 2.33. Use a 0.01 significance level to test the claim that with garlic treatment, the mean change in LDL cholesterol is greater than 0. What do the results suggest about the effectiveness of the garlic treatment? Assume that a simple random sample has been selected. Identify the null and alternative hypotheses, test statistic, P-value, and state the final conclusion that addresses the original claim.arrow_forwardIn a test of the effectiveness of garlic for lowering cholesterol, 49 subjects were treated with raw garlic. Cholesterol levels were measured before and after the treatment. The changes (before minus after) in their levels of LDL cholesterol (in mg/dL) have a mean of 0.9 and a standard deviation of 2.33 . Use a 0.10 significance level to test the claim that with garlic treatment, the mean change in LDL cholesterol is greater than 0 . What do the results suggest about the effectiveness of the garlic treatment? Assume that a simple random sample has been selected. Identify the null and alternative hypotheses, test statistic, P-value, and state the final conclusion that addresses the original claim. What are the null and alternative hypotheses? A. Upper H 0 : mu greater than0 mg/dL Upper H 1 : mu less than0 mg/dL B. Upper H 0 : mu equals0 mg/dL Upper H 1 : mu less than0 mg/dL C. Upper H 0 : mu…arrow_forward
- In a test of the effectiveness of garlic for lowering cholesterol, 81 subjects were treated with raw garlic. Cholesterol levels were measured before and after the treatment. The changes (before minus after) in their levels of LDL cholesterol (in mg/dL) have a mean of 0.9 and a standard deviation of 20.8. Use a 0.05 significance level to test the claim that with garlic treatment, the mean change in LDL cholesterol is greater than 0. What do the results suggest about the effectiveness of the garlic treatment? Assume that a simple random sample has been selected. Identify the null and alternative hypotheses, test statistic, P-value, and state the final conclusion that addresses the original claim. What are the null and alternative hypotheses? O B. H,: H=0 mg/dL Ο Α. Η μ=0 mgldL H1: µ0 mg/dL O D. H,: µ> 0 mg/dL H: µ<0 mg/dL Determine the test statistic. (Round to two decimal places as needed.)arrow_forwardIn a test of the effectiveness of garlic for lowering cholesterol, 64 subjects were treated with raw garlic. Cholesterol levels were measured before and after the treatment. The changes (before minus after) in their levels of LDL cholesterol (in mg/dL) have a mean of 0.2 and a standard deviation of 1.81. Use a 0.10 significance level to test the claim that with garlic treatment, the mean change in LDL cholesterol is greater than 0. What do the results suggest about the effectiveness of the garlic treatment? Assume that a simple random sample has been selected. Identify the null and alternative hypotheses, test statistic, P-value, and state the final conclusion that addresses the original claim. What are the null and alternative hypotheses? O A. Ho: H>0 mg/dL O B. Ho: H=0 mg/dL H:H0 mg/dL Determine the test statistic. (Round to two decimal places as needed.)arrow_forwardIn a test of the effectiveness of garlic for lowering cholesterol, 49 subjects were treated with raw garlic. Cholesterol levels were measured before and after the treatment. The changes (before minus after) in their levels of LDL cholesterol (in mg/dL) have a mean of 0.8 and a standard deviation of 2.04. Use a 0.10 significance level to test the claim that with garlic treatment, the mean change in LDL cholesterol is greater than 0. What do the results suggest about the effectiveness of the garlic treatment? Assume that a simple random sample has been selected. Identify the null and alternative hypotheses, test statistic, P-value, and state the final conclusion that addresses the original claim.arrow_forward
- In a test of the effectiveness of garlic for lowering cholesterol, 49 subjects were treated with raw garlic. Cholesterol levels were measured before and after the treatment. The changes (before minus after) in their levels of LDL cholesterol (in mg/dL) have a mean of 0.6 and a standard deviation of 20.7. Use a 0.05 significance level to test the claim that with garlic treatment, the mean change in LDL cholesterol is greater than 0. What do the results suggest about the effectiveness of the garlic treatment? Assume that a simple random sample has been selected. Identify the null and alternative hypotheses, test statistic, P-value, and state the final conclusion that addresses the original claim. What are the null and alternative hypotheses? A. Ho: μ = 0 mg/dL H₁: μ> 0 mg/dL C. Ho: μ = 0 mg/dL H₁: μ#0 mg/dL Determine the test statistic. (Round to two decimal places as needed.) Determine the P-value. (Round to three decimal places as needed.) State the final conclusion that addresses the…arrow_forwardIn a test of the effectiveness of garlic for lowering cholesterol, 81 subjects were treated with raw garlic. Cholesterol levels were measured before and after the treatment. The changes (before minus after) in their levels of LDL cholesterol (in mg/dL) have a mean of 0.2 and a standard deviation of 17.2. Use a 0.05 significance level to test the claim that with garlic treatment, the mean change in LDL cholesterol is greater than 0. What do the results suggest about the effectiveness of the garlic treatment? Assume that a simple random sample has been selected. Identify the null and alternative hypotheses, test statistic, P-value, and state the final conclusion that addresses the original claim. What are the null and alternative hypotheses? Ο Α. Hρ: μ=0 mg/dL O B. Ho: µ=0 mg/dL H;: u#0 mg/dL H,: µ>0 mg/dL O C . H: μ=0 mg/dL O D. Ho: µ>0 mg/dL H;: µ<0 mg/dL H,:µ<0 mg/dL Determine the test statistic. (Round to two decimal places as needed.) Determine the P-value, (Round to three decimal…arrow_forwardIn a test of the effectiveness of garlic for lowering cholesterol, 64 subjects were treated with raw garlic. Cholesterol levels were measured before and after the treatment. The changes (before minus after) in their levels of LDL cholesterol (in mg/dL) have a mean of 0.6 and a standard deviation of 1.92. Use a 0.05 significance level to test the claim that with garlic treatment, the mean change in LDL cholesterol is greater than 0. What do the results suggest about the effectiveness of the garlic treatment? Assume that a simple random sample has been selected. Identify the null and alternative hypotheses, test statistic, P-value, and state the final conclusion that addresses the original claim. What are the null and alternative hypotheses?arrow_forward
arrow_back_ios
SEE MORE QUESTIONS
arrow_forward_ios
Recommended textbooks for you
- MATLAB: An Introduction with ApplicationsStatisticsISBN:9781119256830Author:Amos GilatPublisher:John Wiley & Sons Inc
 Probability and Statistics for Engineering and th...StatisticsISBN:9781305251809Author:Jay L. DevorePublisher:Cengage Learning
 Statistics for The Behavioral Sciences (MindTap C...StatisticsISBN:9781305504912Author:Frederick J Gravetter, Larry B. WallnauPublisher:Cengage Learning
  Elementary Statistics: Picturing the World (7th E...StatisticsISBN:9780134683416Author:Ron Larson, Betsy FarberPublisher:PEARSON
 The Basic Practice of StatisticsStatisticsISBN:9781319042578Author:David S. Moore, William I. Notz, Michael A. FlignerPublisher:W. H. Freeman
 Introduction to the Practice of StatisticsStatisticsISBN:9781319013387Author:David S. Moore, George P. McCabe, Bruce A. CraigPublisher:W. H. Freeman
MATLAB: An Introduction with Applications
Statistics
ISBN:9781119256830
Author:Amos Gilat
Publisher:John Wiley & Sons Inc
Probability and Statistics for Engineering and th...
Statistics
ISBN:9781305251809
Author:Jay L. Devore
Publisher:Cengage Learning
Statistics for The Behavioral Sciences (MindTap C...
Statistics
ISBN:9781305504912
Author:Frederick J Gravetter, Larry B. Wallnau
Publisher:Cengage Learning
Elementary Statistics: Picturing the World (7th E...
Statistics
ISBN:9780134683416
Author:Ron Larson, Betsy Farber
Publisher:PEARSON
The Basic Practice of Statistics
Statistics
ISBN:9781319042578
Author:David S. Moore, William I. Notz, Michael A. Fligner
Publisher:W. H. Freeman
Introduction to the Practice of Statistics
Statistics
ISBN:9781319013387
Author:David S. Moore, George P. McCabe, Bruce A. Craig
Publisher:W. H. Freeman