
MATLAB: An Introduction with Applications
6th Edition
ISBN: 9781119256830
Author: Amos Gilat
Publisher: John Wiley & Sons Inc
expand_more
expand_more
format_list_bulleted
Related questions
Question
thumb_up100%
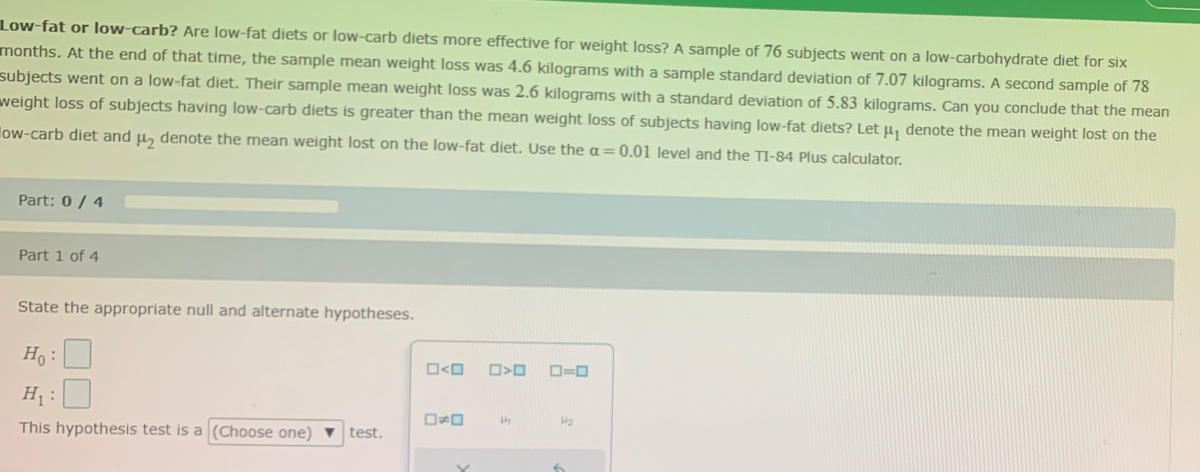

Transcribed Image Text:Low-fat or low-carb? Are low-fat diets or low-carb diets more effective for weight loss? A sample of 76 subjects went on a low-carbohydrate diet for six
months. At the end of that time, the sample mean weight loss was 4.6 kilograms with a sample standard deviation of 7.07 kilograms. A second sample of 78
subjects went on a low-fat diet. Their sample mean weight loss was 2.6 kilograms with a standard deviation of 5.83 kilograms. Can you conclude that the mean
weight loss of subjects having low-carb diets is greater than the mean weight loss of subjects having low-fat diets? Let u, denote the mean weight lost on the
low-carb diet and ₂ denote the mean weight lost on the low-fat diet. Use the a= 0.01 level and the TI-84 Plus calculator.
Part: 0 / 4
Part 1 of 4
1441
State the appropriate null and alternate hypotheses.
B>D
O=O
Ho:
H₁:
Hi
P₂
This hypothesis test is a (Choose one) test.
ロ<ロ
Expert Solution
This question has been solved!
Explore an expertly crafted, step-by-step solution for a thorough understanding of key concepts.

Step by stepSolved in 2 steps

Knowledge Booster

Similar questions
- The mean Math ACT score was 20.5, with a standard deviation of 5.5. Sarah scored a 26 on the Math ACT. According to the empirical rule, what percent of students taking the Math ACT scored higher than Sarah? O 5.5% O 16% O 84% O 2.5%arrow_forwardWhat is the sample standard deviation?arrow_forwardMaple trees in a large forest have heights that are normally distributed with a mean of 95 feet and a standard deviation of 4.7 feet. One tree has a height of 92 feet. What is the Z-score of this height?arrow_forward
- Does the sample size ? affect the standard deviation of all possible samplemeans? Explain your answer.arrow_forwardAverage adult Americans are about one inch taller but nearly a whopping 25 pounds heavier than they were in 1960, according to a report from the Centers for Disease Control and Prevention (CDC). City A is considered one of America's healthiest cities. Is the weight gain since 1960 similar in city A? A sample of n=25 adults suggested a mean increase of 22 pounds with a standard deviation of 9.4 pounds. Is City A significantly different in terms of weight gain since 1960? Complete and interpret 5 step hypothesis testing by hand at a 5% level of significance using a Z-test. Show each step and your work.arrow_forwardAccording to one study, the average hours of sleep on a weeknight for men was 6.9 hours with a standard deviation of 1.5 hours. These hours are normally distributed. c. Find the proportion of men who sleep between 6-8 hours per night. d. Find the number of hours that represents the 90th percentile.arrow_forward
- The average home in the US is expected to cost $240,000. A random sample of 56 homes sold this month showed average price of $232,000. Assume you have access to this data. We are interested in determining cost if the cost of average home has decreased this month. If the test statistic is -1.66 what is the p-value?arrow_forwardIn the class of 2019, more than 1.6 million students took the SAT. The distribution of scores on the math section (out of 800) is approximately normal with a mean of 528 and standard deviation of 117. What proportion of students earned scores between 500 and 600 on the SAT math test?arrow_forwardSuppose we know that the aspirin content of aspirin tablets follows a Normal distribution with standard deviation of o= 5 mg.arrow_forward
- Low-fat or low-carb? Are low-fat diets more effective for weight loss? A sample of 46 subjects went on a low carbohydrate diet for six months. At the end of that time, the sample mean weight loss was 4.6 kilograms with a sample standard deviation of 6.28 kilograms. A second sample of 49 subjects went on a low-fat diet. Their sample mean weight loss was 2.3 kilograms with a standard deviation of 4.66 kilograms. Can you conclude that the mean weight loss differs between the two diets? Let μ1 denote the mean weight lost on the low-carb diet and μ2 denote the mean weight lost on the low-fat diet. Use the =α0.01level and the P-value method. Compute the test statistic. Round the answer to three decimal places. t =arrow_forwardAre low-fat diets or low-carb diets more effective for weight loss? A sample of 78 subjects went on a low-carbohydrate diet for six months. At the end of that time, the sample mean weight loss was 15.0 pounds with a sample standard deviation of 7.77 pounds. A second sample of 74 subjects went on a low-fat diet. Their sample mean weight loss was 16.3 with a standard deviation of 6.10. Can you conclude that the mean weight loss differed between the two diets? Use the a = 0.01 level.arrow_forward
arrow_back_ios
arrow_forward_ios
Recommended textbooks for you
- MATLAB: An Introduction with ApplicationsStatisticsISBN:9781119256830Author:Amos GilatPublisher:John Wiley & Sons Inc
 Probability and Statistics for Engineering and th...StatisticsISBN:9781305251809Author:Jay L. DevorePublisher:Cengage Learning
 Statistics for The Behavioral Sciences (MindTap C...StatisticsISBN:9781305504912Author:Frederick J Gravetter, Larry B. WallnauPublisher:Cengage Learning
  Elementary Statistics: Picturing the World (7th E...StatisticsISBN:9780134683416Author:Ron Larson, Betsy FarberPublisher:PEARSON
 The Basic Practice of StatisticsStatisticsISBN:9781319042578Author:David S. Moore, William I. Notz, Michael A. FlignerPublisher:W. H. Freeman
 Introduction to the Practice of StatisticsStatisticsISBN:9781319013387Author:David S. Moore, George P. McCabe, Bruce A. CraigPublisher:W. H. Freeman
MATLAB: An Introduction with Applications
Statistics
ISBN:9781119256830
Author:Amos Gilat
Publisher:John Wiley & Sons Inc
Probability and Statistics for Engineering and th...
Statistics
ISBN:9781305251809
Author:Jay L. Devore
Publisher:Cengage Learning
Statistics for The Behavioral Sciences (MindTap C...
Statistics
ISBN:9781305504912
Author:Frederick J Gravetter, Larry B. Wallnau
Publisher:Cengage Learning
Elementary Statistics: Picturing the World (7th E...
Statistics
ISBN:9780134683416
Author:Ron Larson, Betsy Farber
Publisher:PEARSON
The Basic Practice of Statistics
Statistics
ISBN:9781319042578
Author:David S. Moore, William I. Notz, Michael A. Fligner
Publisher:W. H. Freeman
Introduction to the Practice of Statistics
Statistics
ISBN:9781319013387
Author:David S. Moore, George P. McCabe, Bruce A. Craig
Publisher:W. H. Freeman