Question

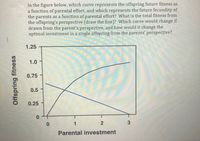
Transcribed Image Text:In the figure below, which curve represents the offspring future fitness as
a function of parental effort, and which represents the future fecundity of
the parents as a function of parental effort? What is the total fitness from
the offspring's perspective (draw the line)? Which curve would change if
drawn from the parent's perspective, and how would it change the
optimal investment in a single offspring from the parents' perspective?
1.25
1.0
0.75
0.5
0.25
Parental investment
Offspring fitness
Expert Solution
This question has been solved!
Explore an expertly crafted, step-by-step solution for a thorough understanding of key concepts.
Step by stepSolved in 3 steps

Knowledge Booster
Similar questions
- Consider the following graph showing clutch sizes and fledgling rates of blue tits. 1000 1.0 800 0.8 600 0.6 400 0.4 200 0.2 ㅇ 0.0 1 3 5 7 9 11 13 15 17 Clutch size The line shows the average number of fledglings surviving (on right y-axis) for a given clutch size (on the x-axis). The histogram bars show the frequency of nests observed (on the y-axis) per clutch size (on the x-axis). Why do most pairs lay fewer eggs (9), than the clutch size with the highest return of fledglings (12)? Frequency Young/clutcharrow_forwardSuppose that in maroon-fronted parrots, the number of chicks born each year in a population is compared to the number of predators in the same area. Correlation coefficient = -0.1 Number of predators From the correlation analysis, is there strong evidence that the number of predators affects the number of parrot chicks? Yes, because the number of chicks decreases as the number of predators increases. No, because the correlation coefficient is close to zero. Yes, because correlation analysis is used to determine the effect of one variable on another. No, because correlation analysis does not determine if there is a causal link between the two variables. Number of parrot chicksarrow_forwardMuch of animal behaviour theory is rooted in optimality, using this theory and thinking about territory size, construct a well-labeled graph below: sketch two lines (one for costs, one for benefits), with an asterisk (or symbol of your choosing) indicate the theoretical optimal territory size and in one sentence, explain why that particular territory size is optimal . Territory Size Costs/benefitsarrow_forward
- If all of the following individuals belonged to the same generation in the same population, who had the highest fitness? O a ballet dancer who has 4 offspring and lives to be 80 years old O a golfer who has 2 offspring and lives to be 23 years old O a body builder who does not reproduce and lives to be 101 years old O a rock climber who has 10 offspring and lives to be 33 years oldarrow_forwardThink about how we organized the mechanisms of sexual selection (mate competition vs. mate choice; resource-based choice vs. non-resource-based choice, etc.). Based on this organization, choose the pair of examples from the list below that are most closely matched in terms of mechanisms of sexual selection. Male red deer engage in physical contests to determine who mates with a female. Male mouse lemurs engage in scramble competition for female mates. Peahen (female) chooses to mate with a peacock that has large eyespots in the tail feathers of his magnificent display. Question 8 Think about how we organized the mechanisms of sexual selection (mate competition vs. mate choice; resource-based choice vs. non-resource-based choice, etc.). Based on this organization, choose the pair of examples from the list below that are most closely matched in terms of mechanisms of sexual selection. Male roadrunner presents female with lizard 'snack' during courtship. Male butterfly transfers sodium to…arrow_forwardA population is solely comprised of 56 A2A2 individuals. 9 A1A1 individuals migrate in and contribute to the mating pool. What is the frequency of A1A2 individuals in the offspring? Answer to 2 decimal places.arrow_forward
- Which of the following are equivalent ways to talk about an allele or genotype of individuals who are able to leave MORE offspring than others in a certain environment? Check all that apply. Group of answer choices A-"has a benefit" B-"has a higher fitness" C-"confers a selective disadvantage" D-"confers a selective advantage" E-"has a cost"arrow_forwardWhat are the relative advantages and disadvantages ofsemelparity and iteroparity? In answering, consider iteroparousspecies that have both short and long expected life spans in theirnatural environments.arrow_forwardAs energy is limited to organisms, females can interpret the production of large or bright badges or ornaments by males as a sign that they have enough energy/resources to produce those signals and still survive. This idea is predicted by the good genes hypothesis. True Falsearrow_forward
- The coefficient of relatedness between you and your uncle on your dad's side is O 0.25 O 0.5 0.125 O 0.75arrow_forwardClassify the examples as pre‑zygotic or post‑zygotic barriers.arrow_forwardGive an example of how variety in a population can lead to resilience when environments change. (Please make it short)arrow_forward
arrow_back_ios
SEE MORE QUESTIONS
arrow_forward_ios