
MATLAB: An Introduction with Applications
6th Edition
ISBN: 9781119256830
Author: Amos Gilat
Publisher: John Wiley & Sons Inc
expand_more
expand_more
format_list_bulleted
Related questions
Question
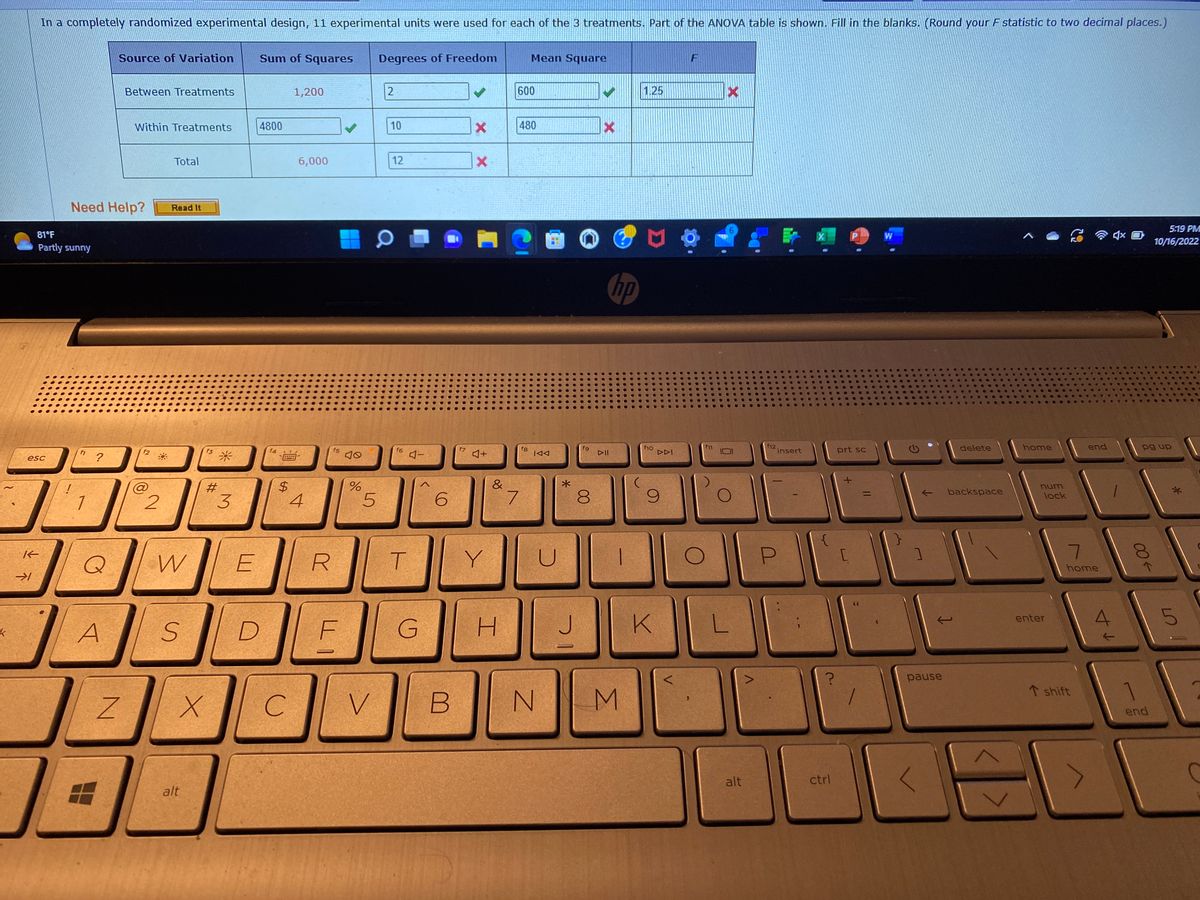

Transcribed Image Text:The image displays part of an ANOVA table used in an experimental design, where 11 experimental units were utilized for each of 3 treatments. Here is the transcription of the table:
### Source of Variation
- **Between Treatments**
- Sum of Squares: 1,200
- Degrees of Freedom: 2
- Mean Square: 600
- F: 1.25
- **Within Treatments**
- Sum of Squares: 4,800
- Degrees of Freedom: 10
- Mean Square: 480
- **Total**
- Sum of Squares: 6,000
- Degrees of Freedom: 12
Correct answers are marked with a green check, and errors are marked with a red "X." Additional instructions state to fill in the blanks and round the F statistic to two decimal places.
Expert Solution
This question has been solved!
Explore an expertly crafted, step-by-step solution for a thorough understanding of key concepts.

This is a popular solution

Trending nowThis is a popular solution!

Step by stepSolved in 2 steps

Knowledge Booster

Similar questions
- A population of values has a normal distribution with 45.2 and a 67.7. You intend to draw a random sample of size n = 108. Please answer the following questions, and show your answers to 1 decimal place. Find the value separating the bottom 35% values from the top 65% values. Find the sample mean separating the bottpm 35% sample means from the top 65% sample means.arrow_forwardAn experiment was carried out to compare the sound distortion produced by 4 different types of coating on magnetic tape. The ANOVA table for this data is given below, where X indicates a missing value. Source Degrees of Freedom Sum of Squares Mean Squares IF Treatment X 14.49 X Error X X X Total 49 165.69 Compute the F statistic. Give your answer to 2 decimal places.arrow_forwardSample data were collected in a study of calcium supplements and their effects on blood pressure. A placebo group and a calcium group began the study with measures of blood pressures for each group. What test would be most appropriate, if you have non-normal data? Name of Test _____________________________________________arrow_forward
- A repeated measures ANOVA produced the partially completed ANOVA summary table below. Use this data to find the correct F-ratio. *image 5.80 20.74 5.68 19.22arrow_forwardFind Pas, that is find 90 percentile of z-score from the standard normal distribution. 6.arrow_forwardz Scores LeBron James, one of the most successful basketball players of all time, has a height of 6 feet 8 inches, or 203 cm. Based on statistics from Data Set 1 “Body Data” in Appendix B, his height converts to the z score of 4.07. How many standard deviations is his height above the mean?arrow_forward
arrow_back_ios
arrow_forward_ios
Recommended textbooks for you
- MATLAB: An Introduction with ApplicationsStatisticsISBN:9781119256830Author:Amos GilatPublisher:John Wiley & Sons Inc
 Probability and Statistics for Engineering and th...StatisticsISBN:9781305251809Author:Jay L. DevorePublisher:Cengage Learning
 Statistics for The Behavioral Sciences (MindTap C...StatisticsISBN:9781305504912Author:Frederick J Gravetter, Larry B. WallnauPublisher:Cengage Learning
  Elementary Statistics: Picturing the World (7th E...StatisticsISBN:9780134683416Author:Ron Larson, Betsy FarberPublisher:PEARSON
 The Basic Practice of StatisticsStatisticsISBN:9781319042578Author:David S. Moore, William I. Notz, Michael A. FlignerPublisher:W. H. Freeman
 Introduction to the Practice of StatisticsStatisticsISBN:9781319013387Author:David S. Moore, George P. McCabe, Bruce A. CraigPublisher:W. H. Freeman
MATLAB: An Introduction with Applications
Statistics
ISBN:9781119256830
Author:Amos Gilat
Publisher:John Wiley & Sons Inc
Probability and Statistics for Engineering and th...
Statistics
ISBN:9781305251809
Author:Jay L. Devore
Publisher:Cengage Learning
Statistics for The Behavioral Sciences (MindTap C...
Statistics
ISBN:9781305504912
Author:Frederick J Gravetter, Larry B. Wallnau
Publisher:Cengage Learning
Elementary Statistics: Picturing the World (7th E...
Statistics
ISBN:9780134683416
Author:Ron Larson, Betsy Farber
Publisher:PEARSON
The Basic Practice of Statistics
Statistics
ISBN:9781319042578
Author:David S. Moore, William I. Notz, Michael A. Fligner
Publisher:W. H. Freeman
Introduction to the Practice of Statistics
Statistics
ISBN:9781319013387
Author:David S. Moore, George P. McCabe, Bruce A. Craig
Publisher:W. H. Freeman