
MATLAB: An Introduction with Applications
6th Edition
ISBN: 9781119256830
Author: Amos Gilat
Publisher: John Wiley & Sons Inc
expand_more
expand_more
format_list_bulleted
Related questions
Question
interpret this 2 way anova in detail
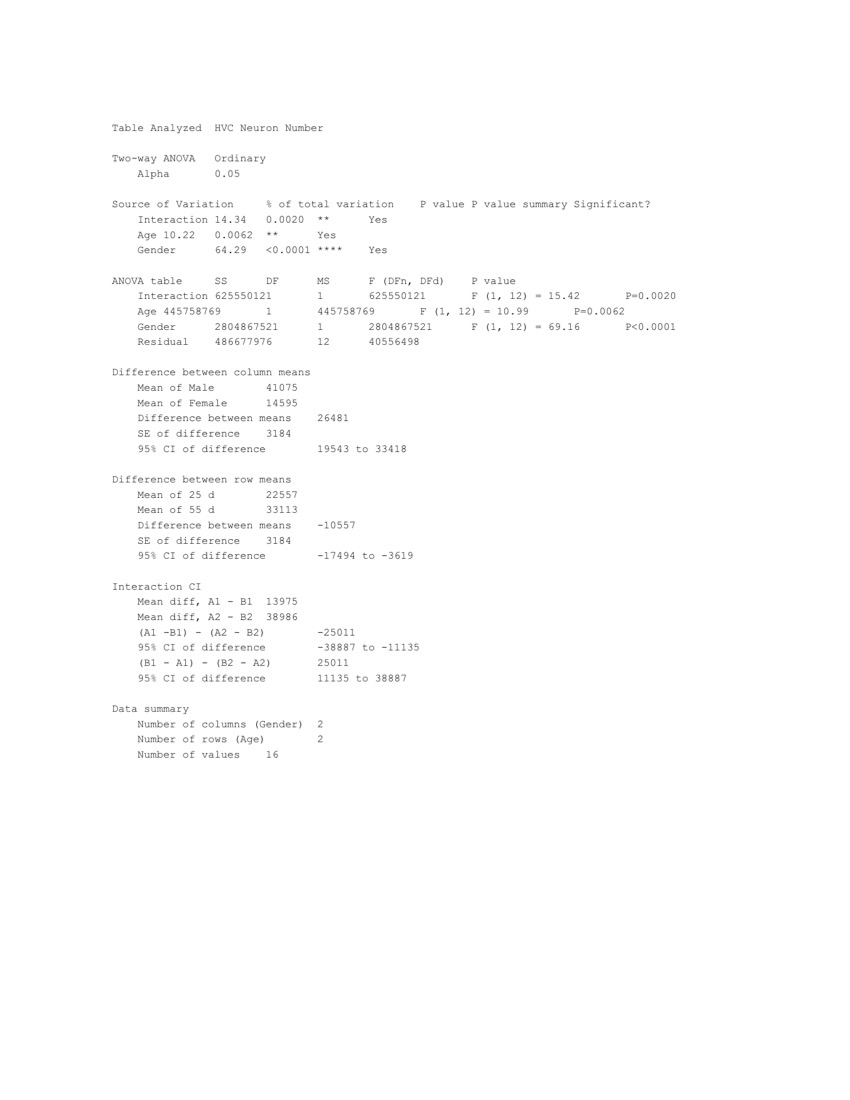

Transcribed Image Text:Table Analyzed HVC Neuron Number
Two-way ANOVA
Alpha
Source of Variation.
Interaction 14.34
Age 10.22 0.0062
Gender
64.29
ANOVA table
Ordinary.
0.05
SS
Interaction 625550121
Age 445758769
Gender
Residual
% of total variation
0.0020 **
Yes
Yes
<0.0001 ****
DF
Interaction CI
1
Difference between column means
Mean of Male
Mean of Female
2804867521
486677976
Data summary
Difference between means.
SE of difference
3184
95% CI of difference
41075
14595
Difference between row means.
22557
33113
Mean of 25 d
Mean of 55 d
Difference between means
3184
SE of difference
95% CI of difference.
Mean diff, Al - B1 13975
38986
Mean diff, A2 B2
(A1-B1) (A2-B2)
95% CI of difference
(B1A1) - (B2 - A2)
95% CI of difference.
Number of columns (Gender)
Number of rows (Age)
Number of values. 16
MS
1
1
12
445758769
26481
Yes
-10557
F (DFn, DFd)
625550121
19543 to 33418
2
2
-17494 to -3619
P value P value summary Significant?
2804867521
40556498
-25011
-38887 to 11135
25011
11135 to 38887
F (1,
P value
F (1, 12) - 15.42
10.99
12)
P=0.0062
F (1, 12)- 69.16
P=0.0020
p<0.0001

Transcribed Image Text:Compare each cell mean with the other cell mean in that row.
Number of families.
1
Number of comparisons per family
Alpha 0.05
Bonferroni's multiple comparisons test. Mean Diff.
Summary Adjusted P Value
Male Female
25 d
55 d
Test details
2
Male Female
25 d
55 d
13975 2447 to 25503 Yes
38986
27458 to 50514 Yes
Mean 1 Mean 2 Mean Diff.
29544 15569 13975 4503
52606 13620 38986 4503
.
****
95.00% CI of diff.
4
4
0.0183
<0.0001
SE of diff.
4
4
N1
N2
3.103
12.00
8.658 12.00
Below threshold?
t
DF
Expert Solution
This question has been solved!
Explore an expertly crafted, step-by-step solution for a thorough understanding of key concepts.

Step by stepSolved in 5 steps

Knowledge Booster

Similar questions
- Describe how to Convert to Transform Standard Scores?arrow_forwardChapter 9, Section 2, Exercise 033 Use the following ANOVA table for regression to answer the questions. Response: Y Source DF Sum Sq Mean Sq F-value Pr(>F) Regression 1 10.050 10.050 1.69 0.194 Residual Error 342 2033.874 5.947 Total 343 2043.924 Give the F-statistic and p-value.Enter the exact answers.The F-statistic is=The p-value is=arrow_forwardHow does changing the degrees of freedom (df) in a t-test affect the outcome?arrow_forward
- Chapter 9, Section 2, Exercise 030 Use the following ANOVA table for regression to answer the questions. Analysis of Variance Source DF SS MS F P Regression 1 304.5 304.5 2.01 0.158 Residual Error 174 26361.0 151.5 Total 175 26665.5 Give the F-statistic and p-value.Enter the exact answers.The F-statistic is=The p-value is=arrow_forwardShow all work/steps! You must use JMP to analyze data.arrow_forwardChapter 9, Section 2, Exercise 032 Use the following ANOVA table for regression to answer the questions. Response: Y Source DF Sum Sq Mean Sq F-value Pr(>F) Regression 1 355.21 355.21 14.76 0.000 Residual Error 359 8641.13 24.07 Total 360 8996.34 Give the F-statistic and p-value.Enter the exact answers.The F-statistic is=The p-value is=arrow_forward
- Explain with the help of example ONE-FACTOR ANOVA.arrow_forwardIn which of these research designs would you only control who gets an intervention and who does not? Experimental Cross-sectional Quasi-experimental Case-Controlarrow_forwardWhat are the different measures used for the OLS estimate of the multiple regression line?arrow_forward
arrow_back_ios
arrow_forward_ios
Recommended textbooks for you
- MATLAB: An Introduction with ApplicationsStatisticsISBN:9781119256830Author:Amos GilatPublisher:John Wiley & Sons Inc
 Probability and Statistics for Engineering and th...StatisticsISBN:9781305251809Author:Jay L. DevorePublisher:Cengage Learning
 Statistics for The Behavioral Sciences (MindTap C...StatisticsISBN:9781305504912Author:Frederick J Gravetter, Larry B. WallnauPublisher:Cengage Learning
  Elementary Statistics: Picturing the World (7th E...StatisticsISBN:9780134683416Author:Ron Larson, Betsy FarberPublisher:PEARSON
 The Basic Practice of StatisticsStatisticsISBN:9781319042578Author:David S. Moore, William I. Notz, Michael A. FlignerPublisher:W. H. Freeman
 Introduction to the Practice of StatisticsStatisticsISBN:9781319013387Author:David S. Moore, George P. McCabe, Bruce A. CraigPublisher:W. H. Freeman
MATLAB: An Introduction with Applications
Statistics
ISBN:9781119256830
Author:Amos Gilat
Publisher:John Wiley & Sons Inc
Probability and Statistics for Engineering and th...
Statistics
ISBN:9781305251809
Author:Jay L. Devore
Publisher:Cengage Learning
Statistics for The Behavioral Sciences (MindTap C...
Statistics
ISBN:9781305504912
Author:Frederick J Gravetter, Larry B. Wallnau
Publisher:Cengage Learning
Elementary Statistics: Picturing the World (7th E...
Statistics
ISBN:9780134683416
Author:Ron Larson, Betsy Farber
Publisher:PEARSON
The Basic Practice of Statistics
Statistics
ISBN:9781319042578
Author:David S. Moore, William I. Notz, Michael A. Fligner
Publisher:W. H. Freeman
Introduction to the Practice of Statistics
Statistics
ISBN:9781319013387
Author:David S. Moore, George P. McCabe, Bruce A. Craig
Publisher:W. H. Freeman