MATLAB: An Introduction with Applications
6th Edition
ISBN: 9781119256830
Author: Amos Gilat
Publisher: John Wiley & Sons Inc
expand_more
expand_more
format_list_bulleted
Concept explainers
Topic Video
Question
thumb_up100%
help

Transcribed Image Text:24.5 16.3 15.7 20.6 15.3 14.5 13.4 15.7 14.4 21.6 16.3 15.9 16.3 18.1 15.5 16.7 13.7 14.3 13.7 16 14.2 17.3 19.5 22.8 16.4 15.4
18.2 13.9 17.6 15.5 17.8 15.2 18.9 17.7 13.7 21 18.4 14.7 16.9 13.8 14.9 14.1 17.6 13.6 21.3 15.1 18.1 16.8 14.2 13.3 19.1 13.2
14.2 16.3 17.4 13.9 22.8 15.1 19.2 15.3

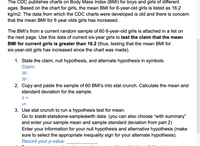
Transcribed Image Text:The CDC publishes charts on Body Mass Index (BMI) for boys and girls of different
ages. Based on the chart for girls, the mean BMI for 6-year-old girls is listed as 16.2
kg/m2. The data from which the CDC charts were developed is old and there is concern
that the mean BMI for 6 year olds girls has increased.
The BMI's from a current random sample of 60 6-year-old girls is attached in a list on
the next page. Use this data of current six-year girls to test the claim that the mean
BMI for current girls is greater than 16.2 (thus, testing that the mean BMIl for
six-year-old girls has increased since the chart was made).
1. State the claim, null hypothesis, and alternate hypothesis in symbols.
Claim:
H::
H" :
2. Copy and paste the sample of 60 BMI's into stat crunch. Calculate the mean and
standard deviation for the sample.
x =
s=
3. Use stat crunch to run a hypothesis test for mean.
Go to statàt-statsàone-sampleàwith data. (you can also choose "with summary"
and enter your sample mean and sample standard deviation from part 2)
Enter your information for your null hypothesis and alternative hypothesis (make
sure to select the appropriate inequality sign for your alternate hypothesis).
Record your p-value:
Expert Solution
This question has been solved!
Explore an expertly crafted, step-by-step solution for a thorough understanding of key concepts.
Step by stepSolved in 3 steps

Knowledge Booster
Learn more about
Need a deep-dive on the concept behind this application? Look no further. Learn more about this topic, statistics and related others by exploring similar questions and additional content below.Similar questions
arrow_back_ios
SEE MORE QUESTIONS
arrow_forward_ios
Recommended textbooks for you
 MATLAB: An Introduction with ApplicationsStatisticsISBN:9781119256830Author:Amos GilatPublisher:John Wiley & Sons Inc
 Probability and Statistics for Engineering and th...StatisticsISBN:9781305251809Author:Jay L. DevorePublisher:Cengage Learning
 Statistics for The Behavioral Sciences (MindTap C...StatisticsISBN:9781305504912Author:Frederick J Gravetter, Larry B. WallnauPublisher:Cengage Learning
 Elementary Statistics: Picturing the World (7th E...StatisticsISBN:9780134683416Author:Ron Larson, Betsy FarberPublisher:PEARSON
 The Basic Practice of StatisticsStatisticsISBN:9781319042578Author:David S. Moore, William I. Notz, Michael A. FlignerPublisher:W. H. Freeman
 Introduction to the Practice of StatisticsStatisticsISBN:9781319013387Author:David S. Moore, George P. McCabe, Bruce A. CraigPublisher:W. H. Freeman

MATLAB: An Introduction with Applications
Statistics
ISBN:9781119256830
Author:Amos Gilat
Publisher:John Wiley & Sons Inc

Probability and Statistics for Engineering and th...
Statistics
ISBN:9781305251809
Author:Jay L. Devore
Publisher:Cengage Learning

Statistics for The Behavioral Sciences (MindTap C...
Statistics
ISBN:9781305504912
Author:Frederick J Gravetter, Larry B. Wallnau
Publisher:Cengage Learning

Elementary Statistics: Picturing the World (7th E...
Statistics
ISBN:9780134683416
Author:Ron Larson, Betsy Farber
Publisher:PEARSON

The Basic Practice of Statistics
Statistics
ISBN:9781319042578
Author:David S. Moore, William I. Notz, Michael A. Fligner
Publisher:W. H. Freeman

Introduction to the Practice of Statistics
Statistics
ISBN:9781319013387
Author:David S. Moore, George P. McCabe, Bruce A. Craig
Publisher:W. H. Freeman