MATLAB: An Introduction with Applications
6th Edition
ISBN: 9781119256830
Author: Amos Gilat
Publisher: John Wiley & Sons Inc
expand_more
expand_more
format_list_bulleted
Question
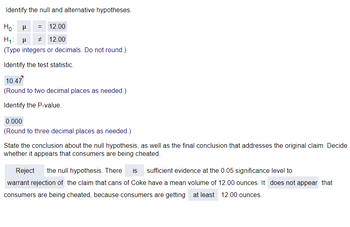
The accompanying data set includes volumes (ounces) of a sample of cans of regular Coke. The summary statistics are n=36,x overbarxequals=12.19612.196oz, s=0.115oz. Assume that a simple random sample has been selected. Use a 0.01 significance level to test the claim that cans of Coke have a

Transcribed Image Text:Identify the null and alternative hypotheses.
Hoμ
= 12.00
H₁ H # 12.00
(Type integers or decimals. Do not round.)
Identify the test statistic.
10.47
(Round to two decimal places as needed.)
Identify the P-value.
0.000
(Round to three decimal places as needed.)
State the conclusion about the null hypothesis, as well as the final conclusion that addresses the original claim. Decide
whether it appears that consumers are being cheated.
Reject
the null hypothesis. There is sufficient evidence at the 0.05 significance level to
warrant rejection of the claim that cans of Coke have a mean volume of 12.00 ounces. It does not appear that
consumers are being cheated, because consumers are getting at least 12.00 ounces.

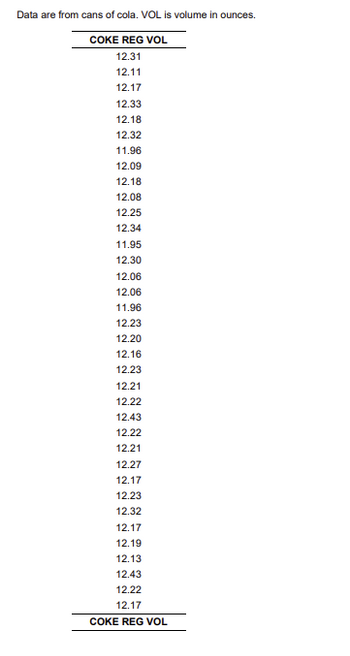
Transcribed Image Text:Data are from cans of cola. VOL is volume in ounces.
COKE REG VOL
12.31
12.11
12.17
12.33
12.18
12.32
11.96
12.09
12.18
12.08
12.25
12.34
11.95
12.30
12.06
12.06
11.96
12.23
12.20
12.16
12.23
12.21
12.22
12.43
12.22
12.21
12.27
12.17
12.23
12.32
12.17
12.19
12.13
12.43
12.22
12.17
COKE REG VOL
Expert Solution
This question has been solved!
Explore an expertly crafted, step-by-step solution for a thorough understanding of key concepts.
Step by stepSolved in 2 steps with 1 images

Knowledge Booster
Similar questions
- Assume the samples are random and independent, the populations are nomally distributed, and the population variances are equal. The table available below shows the prices (in dollars) for a sample of automobile batteries. The prices are classified according to battery type. At a = 0.10, is there enough evidence conclude that at least one mean battery price is different from the others? Complete parts (a) through (e) below. E Click the icon to view the battery cost data. (a) Let u1. P2. H3 represent the mean prices for the group size 35, 65, and 24/24F respectively. Identify the claim and state Ho and H. H Cost of batteries by type The claim is the V hypothesis. Group size 35 Group size 65 Group size 24/24F 101 111 121 124 D 146 173 182 278 124 140 141 89 (b) Find the critical value, Fo, and identify the rejection region. 90 79 84 The rejection region is F Fo, where Fo = (Round to two decimal places as needed.) (c) Find the test statistic F. Print Done F= (Round to two decimal places as…arrow_forwardTo compare the dry braking distances from 30 to 0 miles per hour for two makes of automobiles, a safety engineer conducts braking tests for 35 models of Make A and 35 models of Make B. The mean braking distance for Make A is 42 feet. Assume the population standard deviation is 4.7 feet. The mean braking distance for Make B is 45 feet. Assume the population standard deviation is 4.4 feet. At a = 0.10, can the engineer support the claim that the mean braking distances are different for the two makes of automobiles? Assume the samples are random and independent, and the populations are normally distributed. Complete parts (a) rari rz (b) Find the critical value(s) and identify the rejection region(s). The critical value(s) is/are (Round to three decimal places as needed. Use a comma to separate answers as needed.)arrow_forwardA bottler of drinking water fills plastic bottles with a mean volume of 994 millimeters (mL) with a standard deviation of 5 mL. The fill volumes are normally distributed. What proportion of bottles have volumes less than 995 mL? Use Table A.2 (Normal Distribution Table) and keep four decimal places with your answer.arrow_forward
- researchers wanted to determine if carpeted rooms contained more baterica than uncapted rooms. to determine the amount of bacterica in a room reseachers pumpled the air from the room over a petri dish at the rate of 1 cubic foot per minute for eight carpeted rooms and eight uncaprted rooms. colonies of baterica were alled to form in 16 petri dishes. the results shown below are the baterica counta per cubic foot mean standard deviation sample size capeted room 11.2 2.6774 8 uncapted room 9.7875 3.21 8 you want ti test using sigificance level of 0.01 whether the mean bactiria count is high for carpeted rooms than for uncapteed rooms. test whether the mean bacteria count is high for carpeted rooms thatn uncarpeted rooms. show all steps using the p value method. what is Ho and H1? what is the test statsic and p value? what conclusion can be made?arrow_forwardAvailable below are amounts of arsenic in samples of brown rice from three different regions. The amounts are in micrograms of arsenic and all samples have the same serving size. Use a 0.05 significance level to test the claim that the three samples are from populations with the same mean. Do the amounts of arsenic appear to be different in the different regions? Given that the amounts of arsenic in the samples from region C have the highest mean, can we conclude that brown rice from region C poses the greatest health problem? view the data table of the arsenic amounts. Arsenic Amounts (micrograms) A 4.9 4.9 4.9 5.2 5.3 5.5 5.6 5.7 5.8 5.9 6.1 6.3 B 2.3 3.6 4.5 4.6 4.8 4.8 4.8 5.1 5.1 5.4 5.4 5.5 C 5.7 5.7 6.7 6.9 7.1 7.2 7.2 7.3 7.3 7.4 7.5 7.6 What are the hypotheses to test? H0: mu 1 equals mu 2 equals mu 3μ1=μ2=μ3 H1: At least one…arrow_forwardUse the Empirical Rule. The mean speed of a sample of vehicles along a stretch of highway is 68 miles per hour, with a standard deviation of 3 miles per hour. Estimate the percent of vehicles whose speeds are between 65 miles per hour and 71 miles per hour. (Assume the data set has a bell-shaped distribution.) Approximately nothing% of vehicles travel between 65 miles per hour and 71 miles per hour.arrow_forward
- Suppose that you had collected the following sample data (in inches) on the diameters of tree trunks, measured at waist level and growing at 2000’ elevation in the Cascade Mountains: 9.0, 6.2, 6.5, 7.0, 10.5 and 8.8. The sample Inter Quartile Range is: (a) 5.5 (b) 4.5 (c) 3.5 (d) 2.5 (e) 4.0 (f) None of the abovearrow_forwardSuppose that a customer is purchasing a car. He conducts an experiment in which he puts 10 gallons of gas in the car and drives it until it runs out of gas. He conducts this experiment 15 Sample mean for Car 2 x= 245 mi / 10 gal (Type an integer or decimal rounded to one decimal place as needed.) times on each car and records the number of miles driven. Full data set Car 1 Median for Car 1 M= mi / 10 gal (Type an integer or decimal rounded to one decimal place as needed.) 245 242 215 244 220 265 291 160 284 251 169 319 257 306 267 Car 2 Median for Car 2 230 242 M=O mi / 10 gal 206 214 236 256 245 255 241 264 (Type an integer or decimal rounded to one decimal place as needed.) 276 252 250 251 257arrow_forwardSuppose the National Transportation Safety Board wants to examine the safety of compact cars, midsize cars, and full-size cars. It collects a sample of three for each of the treatments (cars types). Test the claim that the mean pressure applied to the driver's head during a crash is equal for all three types of cars. Use a = 0.05 Compact Cars 643 Midsize Cars 469 Full-size Cars 484 655 m 427 456 20 Apple 702 525 A 402 Show your 6 steps labeled in order in the box below using the p-value method.arrow_forward
arrow_back_ios
arrow_forward_ios
Recommended textbooks for you
 MATLAB: An Introduction with ApplicationsStatisticsISBN:9781119256830Author:Amos GilatPublisher:John Wiley & Sons Inc
 Probability and Statistics for Engineering and th...StatisticsISBN:9781305251809Author:Jay L. DevorePublisher:Cengage Learning
 Statistics for The Behavioral Sciences (MindTap C...StatisticsISBN:9781305504912Author:Frederick J Gravetter, Larry B. WallnauPublisher:Cengage Learning
 Elementary Statistics: Picturing the World (7th E...StatisticsISBN:9780134683416Author:Ron Larson, Betsy FarberPublisher:PEARSON
 The Basic Practice of StatisticsStatisticsISBN:9781319042578Author:David S. Moore, William I. Notz, Michael A. FlignerPublisher:W. H. Freeman
 Introduction to the Practice of StatisticsStatisticsISBN:9781319013387Author:David S. Moore, George P. McCabe, Bruce A. CraigPublisher:W. H. Freeman

MATLAB: An Introduction with Applications
Statistics
ISBN:9781119256830
Author:Amos Gilat
Publisher:John Wiley & Sons Inc

Probability and Statistics for Engineering and th...
Statistics
ISBN:9781305251809
Author:Jay L. Devore
Publisher:Cengage Learning

Statistics for The Behavioral Sciences (MindTap C...
Statistics
ISBN:9781305504912
Author:Frederick J Gravetter, Larry B. Wallnau
Publisher:Cengage Learning

Elementary Statistics: Picturing the World (7th E...
Statistics
ISBN:9780134683416
Author:Ron Larson, Betsy Farber
Publisher:PEARSON

The Basic Practice of Statistics
Statistics
ISBN:9781319042578
Author:David S. Moore, William I. Notz, Michael A. Fligner
Publisher:W. H. Freeman

Introduction to the Practice of Statistics
Statistics
ISBN:9781319013387
Author:David S. Moore, George P. McCabe, Bruce A. Craig
Publisher:W. H. Freeman