MATLAB: An Introduction with Applications
6th Edition
ISBN: 9781119256830
Author: Amos Gilat
Publisher: John Wiley & Sons Inc
expand_more
expand_more
format_list_bulleted
Question
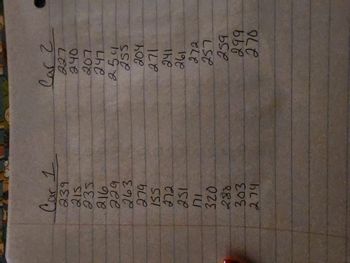
Suppose that a customer is purchasing a car. He conducts an experiment in which he puts 10 gallons of gas in the car and drives it until it runs out of gas. He conducts this experiment 15 times on each car and records the number of miles driven.
1.)
Describe each data set, that is determine the shape, center, and spread.
Sample mean for Car 1
x=enter your response here
mi / 10 gal(Type an integer or decimal rounded to one decimal place as needed.)
Sample mean for Car 2
x=enter your response here
mi / 10 gal(Type an integer or decimal rounded to one decimal place as needed.)
M=enter your response here
mi / 10 gal(Type an integer or decimal rounded to one decimal place as needed.)
Median for Car 2
M=enter your response here
mi / 10 gal(Type an integer or decimal rounded to one decimal place as needed.)
R=enter your response here
mi / 10 gal(Type an integer or decimal rounded to one decimal place as needed.)
Range for Car 2
R=enter your response here
mi / 10 gal(Type an integer or decimal rounded to one decimal place as needed.)
Sample standard deviation for Car 1
s=enter your response here
mi / 10 gal(Type an integer or decimal rounded to one decimal place as needed.)
Sample standard deviation for Car 2
s=enter your response here
mi / 10 gal(Type an integer or decimal rounded to one decimal place as needed.)
2.) Which car would the customer buy and why?

Transcribed Image Text:Car 1
239
215
235
918
bee
263
279
ISS
ele
251
IU
320
288
303
279
Car 2
227
ачо
207
247
254
255
204
271
241
198
272
257
259
299
270
Expert Solution
This question has been solved!
Explore an expertly crafted, step-by-step solution for a thorough understanding of key concepts.
This is a popular solution
Trending nowThis is a popular solution!
Step by stepSolved in 6 steps with 6 images

Knowledge Booster
Similar questions
- Match the description of the sample with the correct plot. Time (in minutes) it takes a sample of employees to drive to work A. Key: 09=0.9 € 200 H 3 678 F 205 210 215 220 THE OB. 5 10 15 20 25 30 35 40 45 Key: 72 = 72 6 89 7 0233678 Aarrow_forwardplease help me with a. Answer there is incorrectarrow_forwardThe following are the starting salaries (in thousands of dollars) of a sample of new research analysts. Use the intuitive approach to determine the quartiles. F: 36 49 50 51 51 54 58 68 69 70 70 72 73 74 76 77 78 79 80 83 84 87 88 89 90 Um SAMSUNG SUBMIT QUESTION SAVE PROGRESS 15°C Sunny > SUBMIT ASSIGNMENT ENG 11:15 AM 9/24/202arrow_forward
- You randomly select and weigh 12 samples of an allergy medicine. Assume the weights are normally distributed. to.99= two digits after the decimal point.) (Round answer to two decimal places. There must bearrow_forwardUsing the given data, find the following. , 1.4, 5.9, 8.3, 15.2, 13.4, 11.8, 17.316.2 Identify the five-number summary. Round your answers to one decimal place as needed. Low =, Q1= MD= Q3= High=arrow_forwardFind the 5 number summary for the data shown x 3.9 5.4 6.5 8.9 11.3 11.8 24.6 27.8 28.4 5 number summary:3.9 ____, ______, ______, 28.4Use the Locator/Percentile method described in your book, not your calculatorarrow_forward
- A vertical line drawn through a normal distribution at z = 0.50 separates the distribution into two sections, the body and the tail. What proportion of the distribution is in the body? a. 0.6915 b. 0.3085 c. 0.1915 d. 0.3830arrow_forwardWhat are percentiles useful for a. showing frequency b.comparing values c. showing concentrationarrow_forwardPlease answer the question on the attachment.arrow_forward
- The following histogram shows the exam scores for the pre algebra class. Use this histogram to answer the questions. Find the class width for this histogram.arrow_forwardchoose the letter of the correct answerarrow_forwardThe paired data below consist of the costs of advertising (in thousands of dollars) and the number of products sold (in thousands): Cost 9 Number 85 O 0.246 -0.071 0.235 0.708 2 52 3 55 Table 3 4 68 2 67 5 86 9 83 10 73arrow_forward
arrow_back_ios
SEE MORE QUESTIONS
arrow_forward_ios
Recommended textbooks for you
 MATLAB: An Introduction with ApplicationsStatisticsISBN:9781119256830Author:Amos GilatPublisher:John Wiley & Sons Inc
 Probability and Statistics for Engineering and th...StatisticsISBN:9781305251809Author:Jay L. DevorePublisher:Cengage Learning
 Statistics for The Behavioral Sciences (MindTap C...StatisticsISBN:9781305504912Author:Frederick J Gravetter, Larry B. WallnauPublisher:Cengage Learning
 Elementary Statistics: Picturing the World (7th E...StatisticsISBN:9780134683416Author:Ron Larson, Betsy FarberPublisher:PEARSON
 The Basic Practice of StatisticsStatisticsISBN:9781319042578Author:David S. Moore, William I. Notz, Michael A. FlignerPublisher:W. H. Freeman
 Introduction to the Practice of StatisticsStatisticsISBN:9781319013387Author:David S. Moore, George P. McCabe, Bruce A. CraigPublisher:W. H. Freeman

MATLAB: An Introduction with Applications
Statistics
ISBN:9781119256830
Author:Amos Gilat
Publisher:John Wiley & Sons Inc

Probability and Statistics for Engineering and th...
Statistics
ISBN:9781305251809
Author:Jay L. Devore
Publisher:Cengage Learning

Statistics for The Behavioral Sciences (MindTap C...
Statistics
ISBN:9781305504912
Author:Frederick J Gravetter, Larry B. Wallnau
Publisher:Cengage Learning

Elementary Statistics: Picturing the World (7th E...
Statistics
ISBN:9780134683416
Author:Ron Larson, Betsy Farber
Publisher:PEARSON

The Basic Practice of Statistics
Statistics
ISBN:9781319042578
Author:David S. Moore, William I. Notz, Michael A. Fligner
Publisher:W. H. Freeman

Introduction to the Practice of Statistics
Statistics
ISBN:9781319013387
Author:David S. Moore, George P. McCabe, Bruce A. Craig
Publisher:W. H. Freeman