MATLAB: An Introduction with Applications
6th Edition
ISBN: 9781119256830
Author: Amos Gilat
Publisher: John Wiley & Sons Inc
expand_more
expand_more
format_list_bulleted
Question

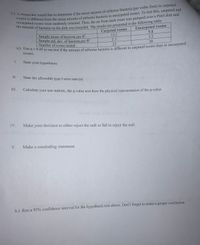
Transcribed Image Text:in
uncam dIfferent from the mean amount of airborne bacteria in uncarpeted rooms. To test this, carpeted and
ount of bacteria on the dish was recorded The results are presented in the following table:
Uncarpeted rooms
Carpeted rooms
12.1
9.8
Sample mean of bacteria per ft'
Sample std. dev. of bacteria per ft
Number of rooms tested
3.2
2.7
23
%3D
U.05 to see test if the amount off airborne bacteria is different in carpeted rooms than in uncarpeted
rooms.
I.
State your hypotheses
II.
State the allowable type I error rate (a.)
III.
Calculate your test statistic, the p-value and draw the physical representation of the p-value
IV.
Make your decision to either reject the null or fail to reject the null.
V.
Make a concluding statement.
b.) Run a 95% confidence interval for the hypothesis test above. Don't forget to make a proper conclusion.
Expert Solution
This question has been solved!
Explore an expertly crafted, step-by-step solution for a thorough understanding of key concepts.
Step by stepSolved in 2 steps with 2 images

Knowledge Booster
Similar questions
- zions Management Spring21 Time left 1:09:43 In a fabric manufacturing factory, the quality control process using control charts from SPC. In an hour there are a total of 5 samples are taken each having 4 observations regarding the thickness of fabric in measured in millimeters. In a particular hour, the sample means (X-bar) are noted to be: 156.46, 199.62, 189.31, 102.22, and112.09 respectively. In the same sample, the corresponding ranges are: 11.97, 12.17, 13.94, 11.86, and 11.83 respectively. What are the lower and upper control limits for the R chart? O a. 0,31.17 O b. 0,28.17 O c. 0,29.17 O d. None is correct O e. 0,24.71 O f. 0,30.47. NEXT PAGE a Type here to searcharrow_forwardno need to sketch just find the areas in betweenarrow_forward1. Review the concept of normal curve. 2. Find the area under the normal curve. 3. Sketch the CURVE and SHADE THE REGION. Write your answer on your answer sheet. 7 Morales i X 1.x = 50 µ= 450=8 Find the area to the right. 2x=109 μ=1160=2.7 Find the area to the left. 3.X=12x2= 16 μ = 10 a = 5 Find the area in between.arrow_forward
- Assume that a randomly selected subject is given a bone density test. Those test scores are normally distributed with a mean of 0 and a standard deviation of 1. Draw a graph and find the probability of a bone density test score greater than -1.62. Sketch the region. Choose the correct graph below. O A. 1.62 Q The probability is (Round to four decimal places as needed.) OB. Q -1.62 -1.62 ♫ OD. Q -1.62 1.62 Εarrow_forward6.1.43 Home Find the indicated critical value. ments Z0.01 book Click to view page 1 of the table. Click to view page 2 of the table. runch Z0.01 = (Round to two decimal places as needed.) pter Contents ltimedia Library Enter your answer in the answer box and then click Check Answer. All parts showing Clear Allarrow_forwardNote: please don’t use excel.arrow_forward
arrow_back_ios
arrow_forward_ios
Recommended textbooks for you
 MATLAB: An Introduction with ApplicationsStatisticsISBN:9781119256830Author:Amos GilatPublisher:John Wiley & Sons Inc
 Probability and Statistics for Engineering and th...StatisticsISBN:9781305251809Author:Jay L. DevorePublisher:Cengage Learning
 Statistics for The Behavioral Sciences (MindTap C...StatisticsISBN:9781305504912Author:Frederick J Gravetter, Larry B. WallnauPublisher:Cengage Learning
 Elementary Statistics: Picturing the World (7th E...StatisticsISBN:9780134683416Author:Ron Larson, Betsy FarberPublisher:PEARSON
 The Basic Practice of StatisticsStatisticsISBN:9781319042578Author:David S. Moore, William I. Notz, Michael A. FlignerPublisher:W. H. Freeman
 Introduction to the Practice of StatisticsStatisticsISBN:9781319013387Author:David S. Moore, George P. McCabe, Bruce A. CraigPublisher:W. H. Freeman

MATLAB: An Introduction with Applications
Statistics
ISBN:9781119256830
Author:Amos Gilat
Publisher:John Wiley & Sons Inc

Probability and Statistics for Engineering and th...
Statistics
ISBN:9781305251809
Author:Jay L. Devore
Publisher:Cengage Learning

Statistics for The Behavioral Sciences (MindTap C...
Statistics
ISBN:9781305504912
Author:Frederick J Gravetter, Larry B. Wallnau
Publisher:Cengage Learning

Elementary Statistics: Picturing the World (7th E...
Statistics
ISBN:9780134683416
Author:Ron Larson, Betsy Farber
Publisher:PEARSON

The Basic Practice of Statistics
Statistics
ISBN:9781319042578
Author:David S. Moore, William I. Notz, Michael A. Fligner
Publisher:W. H. Freeman

Introduction to the Practice of Statistics
Statistics
ISBN:9781319013387
Author:David S. Moore, George P. McCabe, Bruce A. Craig
Publisher:W. H. Freeman