Entrepreneurial Finance
6th Edition
ISBN: 9781337635653
Author: Leach
Publisher: Cengage
expand_more
expand_more
format_list_bulleted
Question
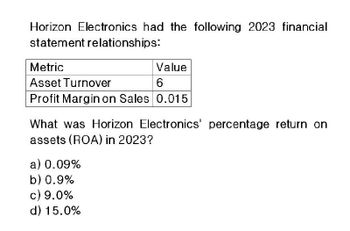
Return on assets in 2023 ? General accounting

Transcribed Image Text:Horizon Electronics had the following 2023 financial
statement relationships:
Metric
Asset Turnover
Value
6
Profit Margin on Sales 0.015
What was Horizon Electronics' percentage return on
assets (ROA) in 2023?
a) 0.09%
b) 0.9%
c) 9.0%
d) 15.0%
Expert Solution
This question has been solved!
Explore an expertly crafted, step-by-step solution for a thorough understanding of key concepts.
Step by stepSolved in 2 steps

Knowledge Booster
Similar questions
- Condensed balance sheet and income statement data for Oriole Corporation are presented here. Cash Accounts receivable (net) Other current assets Investments Property, plant, and equipment (net) Current liabilities Long-term debt Common stock, $10 par Retained earnings Oriole Corporation Balance Sheets December 31 2022 $ 30,100 49,800 89,600 55,100 500,100 $724,700 24 $84,500 145.700 381,000 113.500 $724,700 Sales Less: Sales returns and allowances Net sales Cost of goods sold Gross profit Operating expenses (including income taxes) Net income Oriole Corporation Income Statement For the Years Ended December 31 2022 $16,100 45,500 95,000 70,000 370,800 $597,400 $79,400 84,300 319,000 114,700 $597,400 2021 $744.500 39 200 705 300 424.700 280,600 188.911 $91.689 2021 $605,400 30,700 574.700 366.000 208.700 151 200 $57.470 2020 $18,300 47,900 63,000 46,000 358,600 $533,800 306,000 107,400 $533,800 $69,700 50,700 Additional information: The market price of Oriole's common stock was…arrow_forwardFind the following financial ratios for LVMH Moet Hennessy Louis Vuitton SA (use year-end figures rather than average values where appropriate) (Round your answers to 2 decimal places (e.g., 32.16).) : 2015 2016 Short-term solvency ratios: Current ratio Quick ratio Cash ratio Asset utilization ratios: Total asset turnover Inventory turnover Receivables turnover Long-term solvency ratios: Total debt ratio Debt–equity ratio Equity multiplier Times interest earned ratio Profitability ratios: Profit margin % % Return on assets % % Return on equity % %arrow_forwardIncome statements and balance sheets data for Virtual Gaming Systems are provided below. Net sales Cost of goods sold Gross profit Expenses: VIRTUAL GAMING SYSTEMS Income Statements For the Years Ended December 31 Operating expenses Depreciation expense Loss on sale of land Interest expense Income tax expense Total expenses Net income Assets Current assets: Cash Accounts receivable Inventory Prepaid rent Long-term assets: Investment in bonds Land Equipment Less: Accumulated depreciation Total assets Liabilities and Stockholders' Equity Current liabilities: Accounts payable Interest payable Income tax payable Long-term liabilities: Notes payable 2025 $3,520,000 2,482,000 1,038,000 957,000 32,000 0 19,000 8,200 1,016, 200 21,800 VIRTUAL GAMING SYSTEMS Balance Sheets December 31 2024 $3,046,000 1,952,000 1,094,000 Stockholders' equity: Common stock Retained earnings Total liabilities and stockholders' equity 860,000 28,000 8,200 16,000 49,000 961,200 132,800 2025 $204,000 78,000 128,000…arrow_forward
- What company is better in the short term investmentarrow_forward4. Table 1 below presents some of the financial ratios of Company XYZ for 2019. Table 1. Financial Ratios of Company XYZ, 2019 Value 2.6 12 2.7 16% 2% 20% 60% Ratio Total Asset Turnover Ratio Fixed Asset Turnover Ratio Current Ratio Gross Profit Margin Net Profit Margin Long-term Debt Ratio Total Debt Ratio What is the company's Return on Equity (ROE) for 2019? A. 6.5% B. 13.0% C. 9.6% D. 3.12% Net Protit marigin XTT Xarrow_forwardAnswer this financial accounting questionarrow_forward
- assuming the following ratios are constant, what is the growth rate? Total asset turnover 1.7 Profit margin0.072 Total assets/Equity = 2.15 Payout ratio0.42arrow_forwardCalculate the following ratios for 2021 using working Excel formulas. Make sure to label each appropriately using the following cell (number of days, number of times, etc.) Round each answer to 2 decimal places (example: ROE of .1678 should display as 16.78%): Current Ratio Quick Ratio Debt to Equity Ratio Equity Multiplier Times Interest Earned Dividend Yield Inventory Turnover Days’ Sales in Inventory Receivables Turnover Days’ Sales in Receivables Total Asset Turnover Profit Margin Return on Assets Return on Equity P/E Ratio 2.Calculate Return on Equity (ROE) for 2021 using the Dupontarrow_forwardPlease help me with all answers thankuarrow_forward
- XYZ Corporation had the following data in 2022 below: Total assets = P300,000Gross profit margin = 25%Quick ratio = 0.80 xBond payable = P60,000Days sales outstanding = 36 daysDebt ratio = 50%Retained earnings = P97,500Times interest earned= 6 xInventory turnover = 5 xTotal assets turnover = 1.5 xNo. of days in a year = 360 days Tax rate = 35%Compute the total liabilities.arrow_forwardXYZ Corporation had the following data in 2022 below: Total assets = P300,000Gross profit margin = 25%Quick ratio = 0.80 xBond payable = P60,000Days sales outstanding = 36 daysDebt ratio = 50%Retained earnings = P97,500Times interest earned= 6 xInventory turnover = 5 xTotal assets turnover = 1.5 xNo. of days in a year = 360 days Tax rate = 35%Compute the average merchandise inventory.arrow_forwardEvaluate Aritzia’s profitability for 2022 compared with 2021. In your analysis, compute the following ratios and then comment on what those ratios indicate. 1. Return on sales 2. Asset turnover 3. Return on assets 4. Leverage ratio 5. Return on equity 6. Gross profit percentage 7. Earnings per share (show computation) 8. Book value per shareOperational and Financial Summaryarrow_forward
arrow_back_ios
SEE MORE QUESTIONS
arrow_forward_ios
Recommended textbooks for you
