
MATLAB: An Introduction with Applications
6th Edition
ISBN: 9781119256830
Author: Amos Gilat
Publisher: John Wiley & Sons Inc
expand_more
expand_more
format_list_bulleted
Related questions
Question
General Social Survey (GSS) 2006 collected the data of the number of people in each household in the U.S.
Question: Describe the shape of the distribution.
Skewed to the left, or positively skewed
Skewed to the left, or negatively skewed
Not skewed, or (almost) symmetrical
Skewed to the right, or positively skewed
Skewed to the right, or negatively skewed
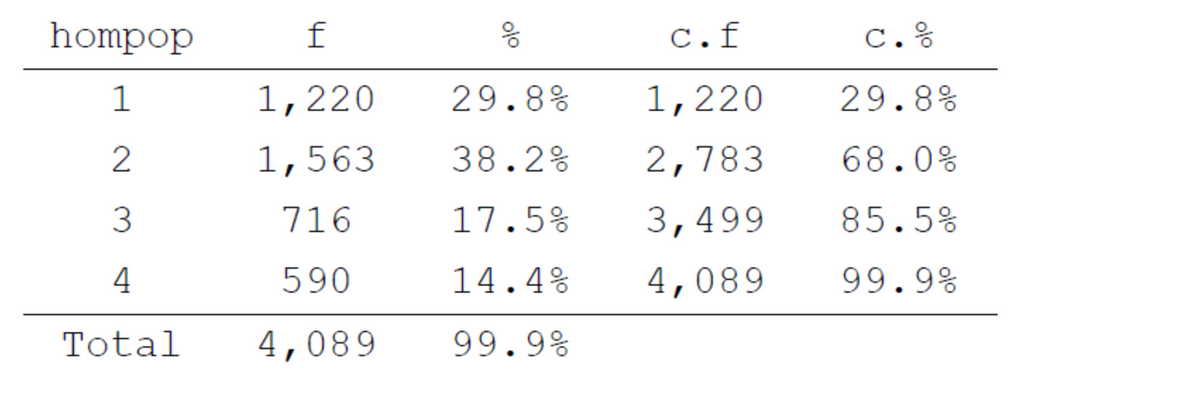

Transcribed Image Text:hompop
1
2
f
1,220
1,563
3
716
4
590
Total 4,089
응
c.f
29.8%
1,220
38.2%
2,783
17.5% 3,499
14.4%
4,089
99.9%
c. %
29.8%
68.0%
85.5%
99.9%
Expert Solution
This question has been solved!
Explore an expertly crafted, step-by-step solution for a thorough understanding of key concepts.

Step by stepSolved in 4 steps with 4 images

Knowledge Booster

Similar questions
- The heights, in inches, of the four members of a barbershop quartet of singers are listed below. 72,68,67,73 Find the population variance for this data set. Round to one decimal place if necessary.arrow_forwardStudents in a statistics class took their first test. The following are the scores they earned. Fill in the stem-and-leaf plot below use the tens place as the stem and the ones place as the leaf. Describe the shape of the distribution. 73 84 95 91 98 97 90 74 74 82 63 79 82 88 74 88 67 81 83 69 73 95 91 94 86 56 94 62 a) Data were collected for variable(s). Is it appropriate to make a stem-and-leaf plot for this type of data and number of variables? . b) Complete the stem-and-leaf plot below. You must put commas between the leaves. Stems Leaves 5 c) What shape is the stem-and-leaf plot above?arrow_forwardDetermine the median axis with the following data: 133, 98, 76, 91, 125.arrow_forward
- A researcher randomly purchases several different kits of a popular building toy. The following table shows the number of pieces in each kit in the sample. Find the mean of the data. Round your answer to the nearest hundredth, if necessary. Building Toy Pieces 152 37 257 342 342 37 96 288 257 101 162 200 Copy Dataarrow_forwardA student was interested in the cigarette-smoking habits of college students and collected data from an unbiased random sample of students. The data are summarized in the following table. Males who smoke Males who do not smoke Females who smoke Females who do not smoke What type of chart best represents the relative class frequencies? Multiple Choice Pie chart Box plot Frequency polygon 10 40 15 60 Scatterplotarrow_forwardUnder each Histogram, write a comment about the shape of the distribution (for example, Symmetric, Skewed (left/right), Uniform or Irregular) Students Frequency Frequency of Students 9 1 0 9 8 1 0 2.0 2.40 1 2 Histogram of Students College GPA 9 2.4 6 4 2.56 Histogram of Students Predicted GPA 9 4 2.8 College GPA 3 2 2.72 Predicted GPA 3.2 3 2.88 3 3 2 3.6 3.04arrow_forward
- Find the (a) mean, (b) median, (c) mode, and (d) midrange for the data and then (e) answer the given question. Listed below are the weights in pounds of 11 players randomly selected from the roster of a championship sports team. Are the results likely to be representative of all players in that sport's league? 234 257 226 278 237 265 290 247 257 307 265 a. Find the mean. The mean is enter your response here pound(s). (Type an integer or a decimal rounded to one decimal place as needed.)arrow_forwardFor the sample scores in the frequency distribution table below, the median is 1 4 4. 1 1 1 3.arrow_forwardExplain the meaning of the specified term. Sample dataarrow_forward
- What is the best way to graphically present the shape of the distribution of numeric variable? a. histogram b. scatter plot c. line graph d. pie chartarrow_forwardCloud seeding, a process in which chemicals such as silver iodide and frozen carbon dioxide are introduced by aircraft into clouds to promote rainfall was widely used in many years. Recent research has questioned its effectiveness. An experiment as performed by randomly assigning 52 clouds to be seeded or not. The amount of rain generated was then measured in acre-feet. The box plot of the data for the seeded and unseeded clouds are shown in the figure. Which statement best interprets the box plot. Boxplot of Seeded, Unseeded 3000 f 2500어 2000 - 1500 - 1000 - 500- Seeded Unseeded a. Cloud seeding is somewhat effective in promoting rainfall because of the greater mean b. Outliers for both seeded and unseeded data may prove data on the effectiveness of cloud seeding is insufficient c. Extreme outliers are evident in the seeded data and has greater variance O d. There's a greater mean and greater dispersion in the seeded data. Both plots show outliers Dataarrow_forwardA County Board of Supervisors has appointed an urban planning committee to evaluate proposed community development projects. The committee is analyzing, among other things, data on household incomes in two cities within the county. They have collected data on the income of 77 households in each of the two cities. The histograms below show the distributions of the two sets of incomes (in thousands of dollars). Each histogram shows household income on the horizontal axis and number of households on the vertical axis. The means and standard deviations for the data sets are also given. City A City B 25+ 20+ 15+ 10+ 5- ← 10 20 30 40 50 60 70 80 90 100 City A mean: 73.96 thousand dollars City A standard deviation: 20.30 thousand dollars Explanation 25- 20- 15- 104 5+ 10 (a) Identify the data set for which it is appropriate to use the Empirical Rule. It is appropriate to use the Empirical Rule for the (Choose one) ▼ data set. 20 30 The committee wants to use the Empirical Rule to make some…arrow_forward
arrow_back_ios
SEE MORE QUESTIONS
arrow_forward_ios
Recommended textbooks for you
- MATLAB: An Introduction with ApplicationsStatisticsISBN:9781119256830Author:Amos GilatPublisher:John Wiley & Sons Inc
 Probability and Statistics for Engineering and th...StatisticsISBN:9781305251809Author:Jay L. DevorePublisher:Cengage Learning
 Statistics for The Behavioral Sciences (MindTap C...StatisticsISBN:9781305504912Author:Frederick J Gravetter, Larry B. WallnauPublisher:Cengage Learning
  Elementary Statistics: Picturing the World (7th E...StatisticsISBN:9780134683416Author:Ron Larson, Betsy FarberPublisher:PEARSON
 The Basic Practice of StatisticsStatisticsISBN:9781319042578Author:David S. Moore, William I. Notz, Michael A. FlignerPublisher:W. H. Freeman
 Introduction to the Practice of StatisticsStatisticsISBN:9781319013387Author:David S. Moore, George P. McCabe, Bruce A. CraigPublisher:W. H. Freeman
MATLAB: An Introduction with Applications
Statistics
ISBN:9781119256830
Author:Amos Gilat
Publisher:John Wiley & Sons Inc
Probability and Statistics for Engineering and th...
Statistics
ISBN:9781305251809
Author:Jay L. Devore
Publisher:Cengage Learning
Statistics for The Behavioral Sciences (MindTap C...
Statistics
ISBN:9781305504912
Author:Frederick J Gravetter, Larry B. Wallnau
Publisher:Cengage Learning
Elementary Statistics: Picturing the World (7th E...
Statistics
ISBN:9780134683416
Author:Ron Larson, Betsy Farber
Publisher:PEARSON
The Basic Practice of Statistics
Statistics
ISBN:9781319042578
Author:David S. Moore, William I. Notz, Michael A. Fligner
Publisher:W. H. Freeman
Introduction to the Practice of Statistics
Statistics
ISBN:9781319013387
Author:David S. Moore, George P. McCabe, Bruce A. Craig
Publisher:W. H. Freeman