MATLAB: An Introduction with Applications
6th Edition
ISBN: 9781119256830
Author: Amos Gilat
Publisher: John Wiley & Sons Inc
expand_more
expand_more
format_list_bulleted
Question
thumb_up100%
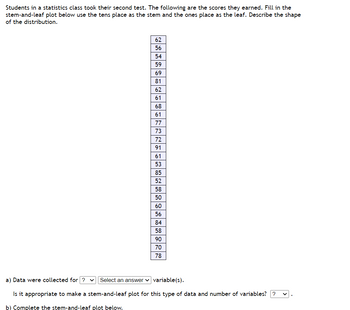
Students in a statistics class took their second test. The following are the scores they earned. Fill in the stem-and-leaf plot below use the tens place as the stem and the ones place as the leaf. Describe the shape of the distribution.
a) Data were collected for variable(s).
Is it appropriate to make a stem-and-leaf plot for this type of data and number of variables? .
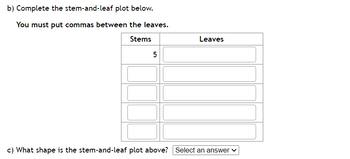
b) Complete the stem-and-leaf plot below.
You must put commas between the leaves.
c) What shape is the stem-and-leaf plot above?

Transcribed Image Text:Students in a statistics class took their second test. The following are the scores they earned. Fill in the
stem-and-leaf plot below use the tens place as the stem and the ones place as the leaf. Describe the shape
of the distribution.
62
56
54
59
69
81
62
61
68
ឌ ន ន ច ឌ ឌ ថ ន ន ន ៖ ៦ ឌ 8 ន ន
61
77
73
72
91
61
53
85
52
58
50
60
Jualul
56
84
58
90
70
a) Data were collected for ? ✓ Select an answer variable(s).
Is it appropriate to make a stem-and-leaf plot for this type of data and number of variables??
b) Complete the stem-and-leaf plot below.

Transcribed Image Text:b) Complete the stem-and-leaf plot below.
You must put commas between the leaves.
Stems
5
Leaves
c) What shape is the stem-and-leaf plot above? Select an answer
Expert Solution
This question has been solved!
Explore an expertly crafted, step-by-step solution for a thorough understanding of key concepts.
This is a popular solution
Trending nowThis is a popular solution!
Step by stepSolved in 5 steps

Knowledge Booster
Similar questions
- in the table below. The data represents the number of students per teacher and the average teacher salaries (in thousands of dollars) in 10 school districts. ents per teacher and average teacher salary. - X Data table OB. Number of OD. Students per Teacher Average Teacher's Salary 55 55- 16.8 29.0 17.8 48.0 18 32.4 28.0 25+ 10 Students/Teacher 17.1 25 10 St 20 18.3 40.7 19.5 34.4 14.7 49.4 17.0 37.6 13.7 42.2 18.9 31.0 Print Done Clear all Check answer ew an example Get more help - Show All D les7e ppt_01_03.pptx D les7e ppt_02_04.pptx D les7e ppt_02_03.pptx D les7e ppt_02_02.pptxarrow_forwardNonearrow_forwardThe following data are the grades of 18 students on an algebra test. 77,74,56,55,85,58,88,71,86,94,63,61,89,87,61,57,85,93 construct a box-and-whisker plot for the data. I attached an example..arrow_forward
- Use the following data to identify the box and whisker plot: 48, 47, 16, 31, 26, 40, 11, 23, 50, 18, 42, 49, 19, 25, 10arrow_forwardState whether you would expect the data set to be normally distributed.Amount of credit card debt of families in the U.S. Normal Not normalarrow_forwardwhich of the follwoing steam and leaf plot best represents the data?arrow_forward
- Use a stem-and-leaf plot to display the data, which represent the numbers of hours 24 nurses work per week. Describe any patterns. 40 42 48 32 40 30 23 40 36 40 Key: 313=33 Hours worked 2 3 4 5 Determine the leaves in the stem-and-leaf plot below. 50 32 36 40 35 38 49 What best describes the data? 40 36 36 40 33 40 32 OA. Most nurses work over 40 hours per week. OB. Most nurses work under 40 hours per week. OC. Most nurses work between 40 and 50 hours per week, inclusive. OD. Most nurses work between 30 and 40 hours per week, inclusive.arrow_forwardStudent grades on a chemistry exam were: 77, 78, 76, 81, 86, 51, 79, 82, 84, 99Construct a stem-and-leaf plot of the data.arrow_forwardPlease do this in excel and show me how to do it. Need helparrow_forward
- Student grades on a chemistry exam were: 79, 78, 76, 82, 86, 50, 79, 81, 83, 99 Construct a stem-and-leaf plot of the data. (Use the tens digit as the stem and the ones digit as the leaf. Enter your answers from smallest to largest, separated by spaces. Enter NONE for stems with no leaves.) 5 6 7 8 9arrow_forwardGiven the following two sets of data, draw a stem and leaf plot.A: 12, 22, 22, 24, 34, 31, 26, 35, 27, 39, 49, 10B: 45, 36, 23, 16, 37, 28, 18, 13, 10, 23, 30, 31arrow_forwardAfter giving a statistics exam, professor Dang determined the following five-number summary for her class results: 60 68 77 89 98. Use this information to draw a box plot of the exam scoresarrow_forward
arrow_back_ios
SEE MORE QUESTIONS
arrow_forward_ios
Recommended textbooks for you
 MATLAB: An Introduction with ApplicationsStatisticsISBN:9781119256830Author:Amos GilatPublisher:John Wiley & Sons Inc
 Probability and Statistics for Engineering and th...StatisticsISBN:9781305251809Author:Jay L. DevorePublisher:Cengage Learning
 Statistics for The Behavioral Sciences (MindTap C...StatisticsISBN:9781305504912Author:Frederick J Gravetter, Larry B. WallnauPublisher:Cengage Learning
 Elementary Statistics: Picturing the World (7th E...StatisticsISBN:9780134683416Author:Ron Larson, Betsy FarberPublisher:PEARSON
 The Basic Practice of StatisticsStatisticsISBN:9781319042578Author:David S. Moore, William I. Notz, Michael A. FlignerPublisher:W. H. Freeman
 Introduction to the Practice of StatisticsStatisticsISBN:9781319013387Author:David S. Moore, George P. McCabe, Bruce A. CraigPublisher:W. H. Freeman

MATLAB: An Introduction with Applications
Statistics
ISBN:9781119256830
Author:Amos Gilat
Publisher:John Wiley & Sons Inc

Probability and Statistics for Engineering and th...
Statistics
ISBN:9781305251809
Author:Jay L. Devore
Publisher:Cengage Learning

Statistics for The Behavioral Sciences (MindTap C...
Statistics
ISBN:9781305504912
Author:Frederick J Gravetter, Larry B. Wallnau
Publisher:Cengage Learning

Elementary Statistics: Picturing the World (7th E...
Statistics
ISBN:9780134683416
Author:Ron Larson, Betsy Farber
Publisher:PEARSON

The Basic Practice of Statistics
Statistics
ISBN:9781319042578
Author:David S. Moore, William I. Notz, Michael A. Fligner
Publisher:W. H. Freeman

Introduction to the Practice of Statistics
Statistics
ISBN:9781319013387
Author:David S. Moore, George P. McCabe, Bruce A. Craig
Publisher:W. H. Freeman