
FINANCIAL ACCOUNTING
10th Edition
ISBN: 9781259964947
Author: Libby
Publisher: MCG
expand_more
expand_more
format_list_bulleted
Related questions
Question
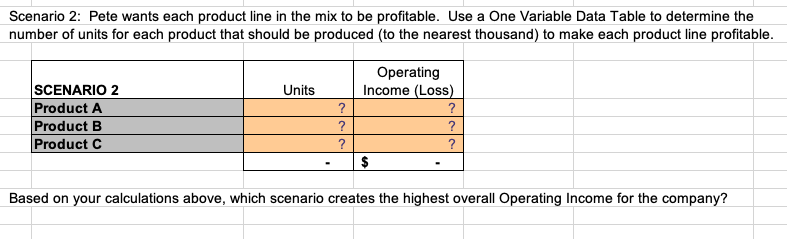

Transcribed Image Text:Scenario 2: Pete wants each product line in the mix to be profitable. Use a One Variable Data Table to determine the
number of units for each product that should be produced (to the nearest thousand) to make each product line profitable.
Operating
Income (Loss)
SCENARIO 2
Product A
Product B
Product C
Units
?
?
?
Based on your calculations above, which scenario creates the highest overall Operating Income for the company?

Transcribed Image Text:Hello Company makes three different products. Due to the constraints of their manufacturing equipment and warehouse facility, the
company is only able to produce, store, and sell a total of 50,000 units each month. The production of Products A and B varies each month;
however, Product C is a special order for one customer who purchases the same number of units every month. Pete Davila, the CEO, has
|provided the following data from last month for each product.
Income Statement
Product A
Product B
Product C
Мax Cарacity
5,000
8.00 $
2.00 $
Units
43,000
10.00 $
3.00 $
20,000 $
2,000
50,000
Price per unit
Variable expense per unit
$
$
$
50.00
15.00 $
20.00
Total Fixed Costs
40,000 $
10,000
Product Sales
$
430,000 $
40,000 $
100,000 $
570,000
(169,000)
401,000
(70,000)
331,000
Variable Costs
(129,000)
(10,000)
30,000 $
(30,000)
70,000 $
Contribution Margin
$
301,000 $
Fixed Costs
(20,000)
281,000
(40,000)
(10,000)
(10,000)
60,000 $
Operating income (loss)
Required
Using the Data Table What-If Analysis tool in Excel, determine the Units and Operating Income (Loss) for each product based
on the following scenarios. (Hint: Don't forget that the warehouse can only hold up to 50,000 units.)
Scenario 1: Pete wants to find the mix of units that will result in the highest overall Operating Income, perform this analysis
using a two-variable data table. Product A can vary between 40,000 units and a maximum of 45,000 units.
Product B can vary between 3,000 units and a maximum of 8,000 units. Both Products A and B are manufactured in
1,000-unit increments. The production level of Product C is the same each month at 2,000 units.
SCENARIO 1
Product A
Product B
Product C
Operating
Income (Loss)
331,000
43,000
43,000
Units
43,000 $
5,000 $
2,000 $
50,000 $
43,000
%24
Expert Solution
This question has been solved!
Explore an expertly crafted, step-by-step solution for a thorough understanding of key concepts.

This is a popular solution

Trending nowThis is a popular solution!

Step by stepSolved in 3 steps

Knowledge Booster


Learn more about
Need a deep-dive on the concept behind this application? Look no further. Learn more about this topic, accounting and related others by exploring similar questions and additional content below.Similar questions
- McNulty, Inc., produces desks and chairs. A new CFO has just been hired and announces a new policy that if a product cannot earn a margin of at least 35 percent, it will be dropped. The margin is computed as product gross profit divided by reported product cost. Manufacturing overhead for year 1 totaled $1,071,000. Overhead is allocated to products based on direct labor cost. Data for year 1 show the following. Chairs Desks Sales revenue $1,580,800 $2,786,000 Direct materials 595,000 910,000 Direct labor 230,000 400,000 Required: a-1. Based on the CFO's new policy, calculate the profit margin for both chairs and desks. a-2. Which of the two products should be dropped? b. Regardless of your answer in requirement (a), the CFO decides at the beginning of year 2 to drop the chair product. The company cost analyst estimates that overhead without the chair line will be $760,000. The revenue and costs for desks are expected to be the same as last year. What is the…arrow_forwardHigh Country, Incorporated, produces and sells many recreational products. The company has just opened a new plant to produce a folding camp cot that will be marketed throughout the United States. The following cost and revenue data relate to May, the first month of the plant’s operation: Beginning inventory 0 Units produced 49,000 Units sold 44,000 Selling price per unit $ 84 Selling and administrative expenses: Variable per unit $ 4 Fixed (per month) $ 561,000 Manufacturing costs: Direct materials cost per unit $ 15 Direct labor cost per unit $ 6 Variable manufacturing overhead cost per unit $ 3 Fixed manufacturing overhead cost (per month) $ 735,000 Management is anxious to assess the profitability of the new camp cot during the month of May. Required: 1. Assume that the company uses absorption costing. a. Calculate the unit product cost. b. Prepare an income statement for May. 2. Assume that the company uses variable costing. a. Calculate the…arrow_forwardGia's Foods produces frozen meals, which it sells for $8 each. The company computes a new monthly fixed manufacturing overhead rate based on the planned number of meals to be produced that month. All costs and production levels are exactly as planned. The following data are from Gia's Foods first month in business. Sales Production Variable manufacturing cost per meal Sales commission cost per meal Total fixed manufacturing overhead Total fixed marketing and administrative costs | January 2007 1,000 meals 1,400 meals $4.00 $1.00 $700 Sóoo Requirements: i) Compute the product cost per meal produced under absorption costing and under variable costing. ii) Prepare the income statement for January 2007 using variable costing iii) List three situations in which marginal costing, as a technique, aids decision-making.arrow_forward
- High Country, Incorporated, produces and sells many recreational products. The company just opened a new plant to produce a folding camp cot that will be marketed throughout the United States. The following cost and revenue data relate to May, the first month of the plant's operation: Beginning inventory Units produced Units sold Selling price per unit Selling and administrative expenses: Variable per unit Fixed (per month) Manufacturing costs: Direct materials cost per unit Direct labor cost per unit Variable manufacturing overhead cost per unit Fixed manufacturing overhead cost (per month) Required: 1. Assume the company uses absorption costing. a. Calculate the camp cot's unit product cost. b. Prepare an income statement for May. 2. Assume the company uses variable costing. a. Calculate the camp cot's unit product cost. b. Prepare a contribution format income statement for May. 0 46,000 41,000 $83 $4 $ 565,000 $ 16 $ 8 $1 $ 782,000 Complete this question by entering your answers in…arrow_forwardHigh Country, Incorporated, produces and sells many recreational products. The company has just opened a new plant to produce a folding camp cot that will be marketed throughout the United States. The following cost and revenue data relate to May, the first month of the plant's operation: Beginning inventory 0 Units produced 43, 000 Units sold 38,000 Selling price per unit $ 80 Selling and administrative expenses: Variable per unit $ 3 Fixed (per month) $ 564,000 Manufacturing costs: Direct materials cost per unit $ 15 Direct labor cost per unit $ 7 Variable manufacturing overhead cost per unit $ 3 Fixed manufacturing overhead cost (per month) $ 817,000 Management is anxious to assess the profitability of the new camp cot during the month of May. Required: 1. Assume that the company uses absorption costing. a. Calculate the unit product cost. b. Prepare an income statement for May. 2. Assume that the company uses variable costing. a. Calculate the unit product cost. b. Prepare a…arrow_forwardPathways Careers, Inc. has two products-Resume Reader and Cover Letter Cure. Financial data for both the products follow: Resume Cover Letter Reader Cure 2,600 units 1,300 units Units sold Sales price per unit Variable manufacturing cost per unit Sales commission (% of sales) $600 320 6% $1,000 650 4% Pathways has two sales representatives-Curtis Muller and Willow Brown. Each sales representative sold a total of 1,950 units during the month of March. Curtis had a sales mix of 60% Resume Reader and 40% Cover Letter Cure. Willow had a sales mix of 80% Resume Reader and 20% Cover Letter Cure. Based on the above information, calculate Willow's total contribution to company profits. OA. $380,640 O B. $120,900 OC. $501,540 OD. $573,300arrow_forward
- Perreth Drycleaners has capacity to clean up to 5,000 garments per month. Requirements 1. Complete the schedule below for the three volumes shown. 2. Why does the average cost per garment change? 3. Suppose the owner, David Perreth, erroneously uses the average cost per unit at full capacity to predict total costs at a volume of 2,000 garments. Would he overestimate or underestimate his total costs? By how much? Requirement 1. Complete the following schedule for the three volumes shown. (Round all unit costs to the nearest cent and all total costs to the nearest whole dollar.) 2,000 3,500 5,000 Garments Garments Garments Total variable costs Total fixed costs Total operating costs Variable cost per garment Fixed cost per garment Average cost per garment $ 1,750 2.00arrow_forwardPetrov Drycleaners has capacity to clean up to 6,000 garments per month. Requirements 1. Complete the schedule below for the three volumes shown. 2. Why does the average cost per garment change? 3. Suppose the owner, Dennis Petrov, erroneously uses the average cost per unit at full capacity to predict total costs at a volume of 3,000 garments. Would he overestimate or underestimate his total costs? By how much? ♥ Requirement 1. Complete the following schedule for the three volumes shown. (Round all unit costs to the nearest cent and all total costs to the nearest whole dollar.) Total variable costs Total fixed costs Total operating costs Variable cost per garment Fixed cost per garment Average cost per garment 3,000 Garments $ $ 4,500 Garments 3,600 2.00 6,000 Garmentsarrow_forwardA corporation makes several products. Because of a recent lack of skilled workers, the corporation has had a shortage of available labor hours. The following per unit data pertains to the related products: Selling price Variable cost Labor hours required Multiple Choice $12,000 The company only has 1,800 labor hours available next month. The company can only sell 800 units of each product a month. What is the maximum amount of contribution margin that it can generate next month? $19,000 $19,600 LO $30 $20 1 $19,800 ES $80 $40 6 CH $42 $20 2arrow_forward
- Mark's Meals produces frozen meals, which it sells for $9 each. The company uses the FIFO inventory costing method, and it computes a new monthly fixed manufacturing overhead rate based on the actual number of meals produced that month. All costs and production levels are exactly as planned. The following data are from the company's first two months in business: (Click the icon to view the data.) Read the requirements. Less Less: Less: Requirement 2b. Prepare Mark's Meals' January and February income statements using variable costing. Less: Montn Endea Mark's Meals Contribution Margin Income Statement (Variable Costing) Month Ended January 31 February 28 As inventory ▼ In February, absorption costing operating income January 31 February 28 Requirement 3. Is operating income higher under absorption costing or variable costing in January? In February? Explain the pattern of differences in operating income based on absorption costing versus variable costing. In January, absorption costing…arrow_forwardSamantha Ross is the procurement manager for the headquarters of a large Financial company chain with a central inventory operation. Ross’ quick-moving inventory item has a demand of 7,000 units per year. Each unit cost $120, and the inventory holding cost is $15 per unit per year. The average ordering cost is $31 per order. It takes about 6 days for an order to arrive. (This is a corporate operation, and there are 250 working days per year.) a) What is the annual cost of ordering and holding inventory? b) Including the cost of the 7,000 units. What is the total annual inventory cost? c) What is the total annual cost?arrow_forwardHigh Country, Incorporated, produces and sells many recreational products. The company has just opened a new plant to produce a folding camp cot that will be marketed throughout the United States. The following cost and revenue data relate to May, the first month of the plant’s operation: Beginning inventory 0 Units produced 45,000 Units sold 40,000 Selling price per unit $ 79 Selling and administrative expenses: Variable per unit $ 3 Fixed (per month) $ 555,000 Manufacturing costs: Direct materials cost per unit $ 16 Direct labor cost per unit $ 7 Variable manufacturing overhead cost per unit $ 4 Fixed manufacturing overhead cost (per month) $ 720,000 Management is anxious to assess the profitability of the new camp cot during the month of May. Required: 1. Assume that the company uses absorption costing. a. Calculate the unit product cost. b. Prepare an income statement for May. 2. Assume that the company uses variable costing. a. Calculate the…arrow_forward
arrow_back_ios
SEE MORE QUESTIONS
arrow_forward_ios
Recommended textbooks for you
 AccountingAccountingISBN:9781337272094Author:WARREN, Carl S., Reeve, James M., Duchac, Jonathan E.Publisher:Cengage Learning,
 Accounting Information SystemsAccountingISBN:9781337619202Author:Hall, James A.Publisher:Cengage Learning,
 Horngren's Cost Accounting: A Managerial Emphasis...AccountingISBN:9780134475585Author:Srikant M. Datar, Madhav V. RajanPublisher:PEARSON
 Intermediate AccountingAccountingISBN:9781259722660Author:J. David Spiceland, Mark W. Nelson, Wayne M ThomasPublisher:McGraw-Hill Education
 Financial and Managerial AccountingAccountingISBN:9781259726705Author:John J Wild, Ken W. Shaw, Barbara Chiappetta Fundamental Accounting PrinciplesPublisher:McGraw-Hill Education
Accounting
Accounting
ISBN:9781337272094
Author:WARREN, Carl S., Reeve, James M., Duchac, Jonathan E.
Publisher:Cengage Learning,
Accounting Information Systems
Accounting
ISBN:9781337619202
Author:Hall, James A.
Publisher:Cengage Learning,
Horngren's Cost Accounting: A Managerial Emphasis...
Accounting
ISBN:9780134475585
Author:Srikant M. Datar, Madhav V. Rajan
Publisher:PEARSON
Intermediate Accounting
Accounting
ISBN:9781259722660
Author:J. David Spiceland, Mark W. Nelson, Wayne M Thomas
Publisher:McGraw-Hill Education
Financial and Managerial Accounting
Accounting
ISBN:9781259726705
Author:John J Wild, Ken W. Shaw, Barbara Chiappetta Fundamental Accounting Principles
Publisher:McGraw-Hill Education