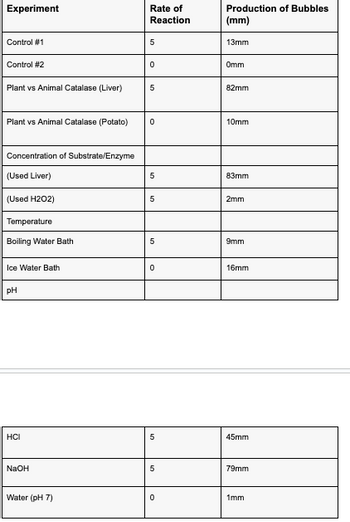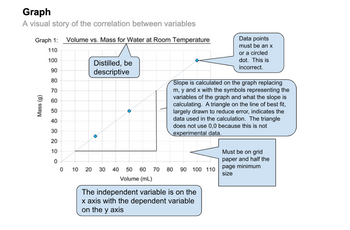
using results for experiment below conduct 1 graph of the different factors vs rate of enzyme activity. *
- after that answer this question using table and graph repfer to them as numbers (eg table 1, graph 1):
Indicate the role of manganese dioxide, sand, distilled water, pH paper, liver and potato.
Is there a relationship between the independent and dependent variables? Explain why or why not.
*NO FUNNEL GRAPHS ACTUAL GRAPH WITH GOOD TITLE , AND MAKE SURE IT LOOKS LIKE THE IMAGE I PLACED BELOW**
important info:
experiment procedure:
The experiment began by preparing a hot water bath by boiling water and an ice water bath using ice in a 400 mL beaker. In the control group, 2 mL of 3% H2O2 was placed in a test tube and a pinch of MnO2 was added. The rate of this reaction was assigned as 5, and the production of bubbles in millimeters (mm) was noted. The reaction was considered complete when no more bubbles were produced. Another control group was set up by placing 2 mL of 3% H2O2 in a test tube and adding a pinch of sand, with the
To investigate the difference between plant and animal catalase, 2 mL of H2O2 was added to a test tube and a small piece of fresh liver was added. The rate of reaction between 0-5 was noted, along with the production of bubbles in mm. The same procedure was repeated using a small piece of fresh potato.
Next, the effect of substrate/enzyme concentration was examined. 2 mL of H2O2 was placed in a test tube and a small piece of fresh liver was added. The reaction was allowed to complete, and then the liver was removed, keeping the H2O2 for the next step. 2 mL of fresh H2O2 was added to the test tube containing the used liver from the previous step, and the rate of reaction between 0-5 was noted. Additionally, a small piece of fresh liver was added to the used H2O2 in the test tube from step 6, and the rate of reaction between 0-5 was recorded.
For the temperature experiment, 2 mL of H2O2 was placed in a test tube and the test tube was briefly submerged in the boiling water bath to heat up. Then, a small piece of fresh liver was added, and the rate of reaction between 0-5 was observed. The same procedure was repeated using an ice water bath instead of the boiling water bath.
Lastly, the effect of pH was investigated. Three test tubes were prepared, each containing a sample of ground liver. To test tube #1, 1 mL of 0.1 M HCl was added, while test tube #2 received 1 mL of 0.1 M NaOH, and test tube #3 was filled with 1 mL of distilled water. pH paper was added to each test tube, followed by 2 mL of H2O2. The rate of reaction between 0-5 and the production of bubbles in mm were recorded for each test tube.
here are the values of the different factors at which the rate of enzyme activity was measured in :
-
Temperature:
- Boiling water bath
- Ice water bath
-
pH:
- pH 3 (HCl)
- pH 12 (NaOH)
- pH 7 (H2O)
-
Control:
- Control #1 (H2O2 + MnO2)
- Control #2 (H2O2 + sand)
-
Plant vs Animal Catalase:
- Plant vs Animal Catalase (Liver)
- Plant vs Animal Catalase (Potato)
-
Concentration of Substance/Enzyme:
- Concentration of Substance Enzyme (Used Liver)
- Concentration of Substance Enzyme (Used H2O2)


to generate a solution
a solution
- Graph a double reciprocal plot that satisfy the following: a. Michaelis-Menten kinetics enzyme, b. an inhibitor that binds only free enzyme (competitive), c. an inhibitor that binds only enzyme-substrate complex.arrow_forwardCHEM151/251 Biochemistry 1 a. Determine Km 1. The following data were obtained for a competitive inhibition study in which the [I] = 3 µM for each determination of vo in the presence of inhibitor. The Vmax = 200 μM P/min for both data sets. 200 Vo (UM P/min) 8 8 8 8 8 8 8 8 8 180 160 140 120 100 40 Name (Print)/ID #: the absence of inhibitor. Participation Question # 10 No Inhibitor 50 +Inhibitor 100 [Substrate] (UM) 150 b. Determine Km, app for the data obtained in presence of inhibitor. 200 c. Calculate the value for Ki. Note: a = 1 + [I]/Ki and a¹ = 1 + [I]/Ki*. for the data obtained inarrow_forwardYou run a series of assays at 25°C on enzyme A. You measure the velocity for a range of S concentrations. What is the Km (in mM) for Enzyme A?arrow_forward
- Pls help ASAP and show all work and explanationsarrow_forwardMAKE A GRAPH FOR ME ON GRAPH PAPER CALL IT ENZYMES VS RATE OF REACTION USING TABLE BELOW GRAPH paper INSERTED BELOW rules: data points must be an x or circled dot, must be on grid paper , the independant variable on the x axis and dependant variable on the y axis, must include titles Regarding the data points: - H2O2 + MnO2 Control #1: (Control #1, 5)- H2O2 + sand control #2: (Control #2, 0)- Plant versus Animal Liver Catalase: (Liver, 4)- Potato: Plant vs. Animal Catalase: (Potato, 3)- Substance Enzyme Concentration (Used Liver): (Liver Used, 4)- Substance Enzyme Concentration (Used H2O2): (Used H2O2, 1) - Boiling Water Bath Temperature: (Boiling Water Bath, 5)- Ice Water Bath Temperature: (Ice Water Bath, 2)- HCl, or pH 3: (H 3, 4)- NaOH at pH 12: (pH 12, 2)- pH 7 (H2O): (assuming average of pH readings; pH 7, not specified) The following explains how to display the graph: Title: Factors versus Enzyme Activity Rate - Labels on X- and Y-axes: Factors and Rate of Enzyme…arrow_forwardBIOCHEMISTRY QUESTION The initial rate (VO) data as a function of substrate concentration [S] for an enzyme (Enzyme1) that obeys Michaelis-Menten kinetics are shown in the table below. The total enzyme concentration is 2.5 nM. [S](μm) 16.0 8.0 4.0 2.0 1.0 v (μMsec ¹) 48.5 32.7 19.8 11.1 5.88 (a) Calculate KM for the enzyme, using the estimated slope (slope = (y2-y1)/(x2-x1)) from a Lineweaver-Burk plot. Show your work and don't forget the units! (b) When the enzyme concentration is 2.5 nM, a Lineweaver-Burk plot of this data gives a line with a y- intercept of 0.0106 μ M-1 sec. Calculate kcat for the enzyme. (Show your work and don't forget to include units). (c) A second enzyme (Enzyme2) also obeys Michaelis-Menten kinetics. Its kcat and KM are 800 sec-1 and 5 µM, respectively. Which is the more efficient enzyme? Briefly explain d) Is Enzyme 1 diffusion limited? Explain.arrow_forward
- Is the data that you are collecting in the above table quantitative or qualitative? Explain why. Which treatment had the least amount of browning? Which had the most? Why do you think you obtained these results? Remember that the enzyme polyphenol oxidase is a protein! For each treatment, apply your knowledge of how temperature, pH, and salt concentration affect enzyme activity and explain why you got the results that you did. Include bonds and the levels of protein structure that you explored in Activity A in your answer. How does temperature impact the rate of enzyme activity? If you were to leave the apple in the refrigerator longer, why would it eventually brown? Explain based on what you know about enzyme activity. How does pH and its impact on specific types of bonds explain the results you obtained in your lemon juice treatment? Include bonds and levels of protein structure in your answer. How does salt and its impact on specific types of bonds explain the results you obtained…arrow_forwardPart 1: Assess the following partial results section below by editing it for brevity by omitting any unnecessary parts (1 point), explain why you decided to remove certain sections (1 point): To evaluate inhibitory effects of the selected molecules, 10mM stock solutions of each molecule were prepared in DMSO. A reaction mixture (200μl) was prepared with the same formula optimized for the enzyme activity assay (0.1 M Tris-HCl ph 8, 0.1 M KCI, 25 mM NaCl, 0.25 mM ATP, and two units of inorganic yeast pyrophosphatase) with 10 µM of the sample molecule. The reaction mixture was incubated for 20 minutes at ambient temperature. Enzymatic reaction was triggered by addition of the substrate B (0.2 mM) and the absorbance of the product was monitored at 290 nm for 10 minutes. Six out of 15 sample molecules showed appreciable inhibition at 10 μM (Figure 5). Three of the molecules, A3, A6, and A7 exhibited more than 50% inhibition of the enzyme activity and were further diluted to find the minimal…arrow_forwardIf 10 µM enzyme was used to obtain the data in the summary plot below, k-cat = ________________ sec-1 and efficiency = _________________ sec-1 M-1 for this enzyme. (Enter numeric answers to the nearest integer; Do NOT write unts.)arrow_forward
 BiochemistryBiochemistryISBN:9781319114671Author:Lubert Stryer, Jeremy M. Berg, John L. Tymoczko, Gregory J. Gatto Jr.Publisher:W. H. Freeman
 Lehninger Principles of BiochemistryBiochemistryISBN:9781464126116Author:David L. Nelson, Michael M. CoxPublisher:W. H. Freeman
 Fundamentals of Biochemistry: Life at the Molecul...BiochemistryISBN:9781118918401Author:Donald Voet, Judith G. Voet, Charlotte W. PrattPublisher:WILEY
 BiochemistryBiochemistryISBN:9781305961135Author:Mary K. Campbell, Shawn O. Farrell, Owen M. McDougalPublisher:Cengage Learning
 BiochemistryBiochemistryISBN:9781305577206Author:Reginald H. Garrett, Charles M. GrishamPublisher:Cengage Learning
 Fundamentals of General, Organic, and Biological ...BiochemistryISBN:9780134015187Author:John E. McMurry, David S. Ballantine, Carl A. Hoeger, Virginia E. PetersonPublisher:PEARSON


