MATLAB: An Introduction with Applications
6th Edition
ISBN: 9781119256830
Author: Amos Gilat
Publisher: John Wiley & Sons Inc
expand_more
expand_more
format_list_bulleted
Question

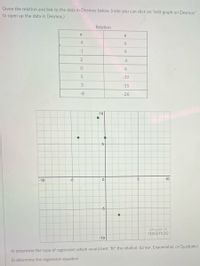
Transcribed Image Text:Given the relation and link to the data in Desmos below, (note you can click on "edit graph on Desmos"
to open up the data in Desmos.)
Relation
-4
-1
9.
-6
6
-39
3
-15
-8
-26
10
5-
-10
-5
10
-5
edit graph on
desmos
-10
A) determine the type of regression which would best "fit" the relation: (Linear, Exponential, or Quadratic)
B) determine the regression equation
Expert Solution
This question has been solved!
Explore an expertly crafted, step-by-step solution for a thorough understanding of key concepts.
Step by stepSolved in 3 steps with 6 images

Knowledge Booster
Similar questions
- Part 3 of 5 (c) Use the data points (4, 1.4) and (28, 2.6) to find an equation of the line through these points. Express numbers as decimals or integers. Write the answer in slope-intercept form (y=mx+b). The equation is 0=0 Ś Xarrow_forwardA study of king penguins looked for a relationship between how deep the penguins dive to seek food and how long they stay underwater. For all but the shallowest dives, there is a linear relationship that is different for different penguins. The study report gives a scatterplot for one penguin titled, “The relation of dive duration (DD) to depth (D).” Duration DD is measured in minutes, and depth D is in meters. The report then says, “The regression equation for this bird is DD=2.69+0.0138D. (a) What is the slope of the regression line? (Enter your answer rounded to four decimal places.) slope = (b) On average, if the depth of the dive increases by one meter, what is the increase in the diving duration? (Enter your answer rounded to four decimal places.) increase in duration = minutes (c) According to the regression line, how long does a typical dive to a depth of 168 meters last? (Enter your answer rounded to three decimal places.) length…arrow_forwardIf a regression line for two variables has a small positive slope, then the: variables are positively associated? variables are negatively associated? association of the variables cannot be determined. variables have no association with each other.arrow_forward
- Show your work please.arrow_forwardThe following linear regression model can be used to predict ticket sales at a popular water park. Ticket sales per hour = - 631.25 + 11.25(current temperature in °F)23) Choose the statement that best states the meaning of the slope in this context. A) The slope tells us that a one degree increase in temperature is associated with an average increase in ticket sales of 11.25 tickets. B) The slope tells us that high temperatures are causing more people to buy tickets to the water park. C) The slope tells us that if ticket sales are decreasing there must have been a drop in temperature. D) None of thesearrow_forwardPlease helparrow_forward
- Residual analysis is important when studying the potential for linear regression because it allows for assumptions to be ignored for a time while graphs are created. True O Falsearrow_forwardRange of ankle motion is a contributing factor to falls among the elderly. Suppose a team of researchers is studying how compression hosiery, typical shoes, and medical shoes affect range of ankle motion. In particular, note the variables Barefoot and Footwear2. Barefoot represents a subject's range of ankle motion (in degrees) while barefoot, and Footwear2 represents their range of ankle motion (in degrees) while wearing medical shoes. Use this data and your preferred software to calculate the equation of the least-squares linear regression line to predict a subject's range of ankle motion while wearing medical shoes, ?̂ , based on their range of ankle motion while barefoot, ? . Round your coefficients to two decimal places of precision. ?̂ = A physical therapist determines that her patient Jan has a range of ankle motion of 7.26°7.26° while barefoot. Predict Jan's range of ankle motion while wearing medical shoes, ?̂ . Round your answer to two decimal places. ?̂ = Suppose Jan's…arrow_forwardExplain what is meant when two variables are positively linesrly related. What would scatter plott look like? Two variables x and y are postively linearly related if when the x value increases , the y value increases or decrease? The points on a scatter plot fall approximately in a-an ascending straight line b- a descending curve c- a descending straight line or d- an ascending curve from left to right?arrow_forward
arrow_back_ios
arrow_forward_ios
Recommended textbooks for you
 MATLAB: An Introduction with ApplicationsStatisticsISBN:9781119256830Author:Amos GilatPublisher:John Wiley & Sons Inc
 Probability and Statistics for Engineering and th...StatisticsISBN:9781305251809Author:Jay L. DevorePublisher:Cengage Learning
 Statistics for The Behavioral Sciences (MindTap C...StatisticsISBN:9781305504912Author:Frederick J Gravetter, Larry B. WallnauPublisher:Cengage Learning
 Elementary Statistics: Picturing the World (7th E...StatisticsISBN:9780134683416Author:Ron Larson, Betsy FarberPublisher:PEARSON
 The Basic Practice of StatisticsStatisticsISBN:9781319042578Author:David S. Moore, William I. Notz, Michael A. FlignerPublisher:W. H. Freeman
 Introduction to the Practice of StatisticsStatisticsISBN:9781319013387Author:David S. Moore, George P. McCabe, Bruce A. CraigPublisher:W. H. Freeman

MATLAB: An Introduction with Applications
Statistics
ISBN:9781119256830
Author:Amos Gilat
Publisher:John Wiley & Sons Inc

Probability and Statistics for Engineering and th...
Statistics
ISBN:9781305251809
Author:Jay L. Devore
Publisher:Cengage Learning

Statistics for The Behavioral Sciences (MindTap C...
Statistics
ISBN:9781305504912
Author:Frederick J Gravetter, Larry B. Wallnau
Publisher:Cengage Learning

Elementary Statistics: Picturing the World (7th E...
Statistics
ISBN:9780134683416
Author:Ron Larson, Betsy Farber
Publisher:PEARSON

The Basic Practice of Statistics
Statistics
ISBN:9781319042578
Author:David S. Moore, William I. Notz, Michael A. Fligner
Publisher:W. H. Freeman

Introduction to the Practice of Statistics
Statistics
ISBN:9781319013387
Author:David S. Moore, George P. McCabe, Bruce A. Craig
Publisher:W. H. Freeman