
MATLAB: An Introduction with Applications
6th Edition
ISBN: 9781119256830
Author: Amos Gilat
Publisher: John Wiley & Sons Inc
expand_more
expand_more
format_list_bulleted
Related questions
Concept explainers
Question
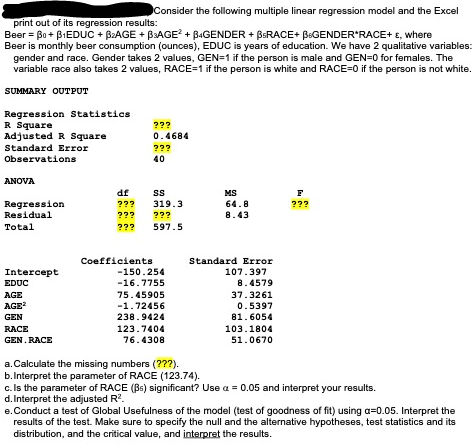

Transcribed Image Text:IConsider the following multiple linear regression model and the Excel
print out of its regression results:
Beer = Bo + BIEDUC + B2AGE + BAGE? + BAGENDER + BERACE+ BEGENDER*RACE+ E, where
Beer is monthly beer consumption (ounces), EDUC is years of education. We have 2 qualitative variables:
gender and race. Gender takes 2 values, GEN=1 if the person is male and GEN=0 for females. The
variable race also takes 2 values, RACE=1 if the person is white and RACE=0 if the person is not white.
SUMMARY OUTPUT
Regression Statistics
R Square
Adjusted R Square
Standard Error
Observations
???
0.4684
???
40
ANOVA
df
MS
Regression
Residual
???
319.3
64.8
???
???
???
8.43
Total
???
597.5
Coefficients
Standard Error
Intercept
-150.254
107.397
EDUC
-16.7755
8.4579
75.45905
-1.72456
AGE
37.3261
AGE
0.5397
GEN
238.9424
81.6054
RACE
123.7404
103.1804
GEN. RACE
76.4308
51.0670
a. Calculate the missing numbers (???).
b.Interpret the parameter of RACE (123.74).
c. Is the parameter of RACE (Bs) significant? Use a = 0.05 and interpret your results.
d. Interpret the adjusted R?.
e.Conduct a test of Global Usefulness of the model (test of goodness of fit) using a=0.05. Interpret the
results of the test. Make sure to specify the null and the alternative hypotheses, test statistics and its
distribution, and the critical value, and interpret the results.
Expert Solution
This question has been solved!
Explore an expertly crafted, step-by-step solution for a thorough understanding of key concepts.

Step by stepSolved in 4 steps

Knowledge Booster


Learn more about
Need a deep-dive on the concept behind this application? Look no further. Learn more about this topic, statistics and related others by exploring similar questions and additional content below.Similar questions
- The line of best fit through a set of data is y = – 27.749 + 1.474x According to this equation, what is the predicted value of the dependent variable when the independent variable has value 30? y = Round to 1 decimal place.arrow_forwardLet price denote a price index for the goods sold by a restaurant, advert the amount spent on advertising, sales the sales for the restaurant, and consider the following two regressions First regression: sales = B1 + B2price + B3price? + B4advert + ßsadvert? + e, Second regression: sales = B1 + B2price + B3price? + e We estimate both regressions using a sample of 105 observations. The sum of square residuals (E ê) from the first regression equals 50, while the sum of square Li=1 residuals from the second regression equals 70. Suppose we are interested in testing the null hypothesis that expected sales do not depend on advertising. What is the F- statistic for this null hypothesis? Recall the F-statistic is given by ((SSER - SSEU)/J)/(SSEy/(n – K)). O a. -15 O b. 42 Oc. 21 O d. 20 O e. All other options are incorrect.arrow_forwardHeights (in centimeters) and weights (in kilograms) of 7 supermodels are given below. Find the regression equation, letting the first variable be the independent (x) variable, and predict the weight of a supermodel who is 171 cm tall. \begin{array}{c|ccccccc} \mbox{Height} & 174 & 166 & 176 & 176 & 178 & 172 & 172 \cr \hline \mbox{Weight} & 55 & 47 & 55 & 56 & 58 & 52 & 53 \cr \end{array} The regression equation is \hat{y} = + x . The best predicted weight of a supermodel who is 171 cm tall isarrow_forward
- The line of best fit through a set of data isy=46.539+4.023xy=46.539+4.023xAccording to this equation, what is the predicted value of the dependent variable when the independent variable has value 40?y = Round to 1 decimal place.arrow_forwardWhich statement is not correct for multiple regression model? When we interpret this categorical variable, we would say the change we observe when one switches from the reference category to the specific category. The reference category will not be displayed in our model results. If we include a categorical variable with more than two values (e.g., religion) as an independent variable, we want to include a dummy variable for all categories except for two. We can include more than two categorical variables in the model. The value of the independent variable not included in the model is called "reference category."arrow_forwardThe data show The chest size and weight of several bears find regression equation, letting chest size be the independent variable then find the best predicted weight of a bear with a chest size of 51 inches is the result close to the actual weight of 422 pounds use a significance level of 0.05 Chest size : 45, 50, 43, 43, 52, 52. Weight : 352, 374, 275, 314, 440, 367.arrow_forward
- Can a causal relationship be established between a variable y and a variable x by running the following regressions: i) y = f(x) and ii) x = f(y). Explain in less than 75 words.arrow_forwardWhat's a good topic for a regression topic? Make sure you have two quantitative variables (for example # of siblings and heart rate). Ask for another variable like academic year, major, hobbies, favorite genre of movie. - State the independent and dependent variables and what is the population.arrow_forward
arrow_back_ios
arrow_forward_ios
Recommended textbooks for you
- MATLAB: An Introduction with ApplicationsStatisticsISBN:9781119256830Author:Amos GilatPublisher:John Wiley & Sons Inc
 Probability and Statistics for Engineering and th...StatisticsISBN:9781305251809Author:Jay L. DevorePublisher:Cengage Learning
 Statistics for The Behavioral Sciences (MindTap C...StatisticsISBN:9781305504912Author:Frederick J Gravetter, Larry B. WallnauPublisher:Cengage Learning
  Elementary Statistics: Picturing the World (7th E...StatisticsISBN:9780134683416Author:Ron Larson, Betsy FarberPublisher:PEARSON
 The Basic Practice of StatisticsStatisticsISBN:9781319042578Author:David S. Moore, William I. Notz, Michael A. FlignerPublisher:W. H. Freeman
 Introduction to the Practice of StatisticsStatisticsISBN:9781319013387Author:David S. Moore, George P. McCabe, Bruce A. CraigPublisher:W. H. Freeman
MATLAB: An Introduction with Applications
Statistics
ISBN:9781119256830
Author:Amos Gilat
Publisher:John Wiley & Sons Inc
Probability and Statistics for Engineering and th...
Statistics
ISBN:9781305251809
Author:Jay L. Devore
Publisher:Cengage Learning
Statistics for The Behavioral Sciences (MindTap C...
Statistics
ISBN:9781305504912
Author:Frederick J Gravetter, Larry B. Wallnau
Publisher:Cengage Learning
Elementary Statistics: Picturing the World (7th E...
Statistics
ISBN:9780134683416
Author:Ron Larson, Betsy Farber
Publisher:PEARSON
The Basic Practice of Statistics
Statistics
ISBN:9781319042578
Author:David S. Moore, William I. Notz, Michael A. Fligner
Publisher:W. H. Freeman
Introduction to the Practice of Statistics
Statistics
ISBN:9781319013387
Author:David S. Moore, George P. McCabe, Bruce A. Craig
Publisher:W. H. Freeman